SpatialExperiment data class for storing and manipulating spatial transcriptomics datasets within the Bioconductor framework.
Bioconductor provides several data classes for storing and manipulating spatial (transcript)omics datasets. By relying on these consistent data structures, we can easily connect methods and packages developed by different research groups to build comprehensive analysis workflows.
Below, we describe the Bioconductor data classes used in this book.
Spatial (transcript)omics assays and the data acquired through them are diverse. In addition, different vendors provide different file formats upon data distribution. Here, we give an overview of frequently encountered file formats and their handling in R.
Data from sequencing-based assays typically include cell or spot barcodes and metadata, and a matrix where rows/columns correspond to features/observations. These are typically provided as a set of .csv and .mtx files, or compressed versions of these (e.g. .gz). For data from 10x Genomics, count data can be read into R using the DropletUtils read10xCounts() function. Data from other providers can also be imported using provided R readers.
For large-scale datasets (say, 100,000s of cells or spots), .h5 files allow for out-of-memory representation of count matrices, represented as DelayedArray objects in R (see HDF5Array).
Tabular data (e.g. segmentation boundaries, molecule locations) may arrive in the form of .parquet files. These may be interfaced with using arrow. Notably, arrow’s read_parquet() function allows for delayed dplyr style operations, such as filter() and select(), allowing users to query the data in a delayed fashion in order to, e.g., import only relevant parts into memory.
.zarr stores can be used to store N-dimensional arrays as a grid of “chunks”, enabling parallelizable accession. For (bio)imaging data, different image scales (or resolutions) can be stored as different layers of a “pyramid”, where the base/tip represents the full/lowest resolution. R interfaces to .zarr are provided through Bioconductor’s Rarr package (Smith and Gruson 2023), and pizzarr.
alabaster
alabaster.base (Lun 2023) aims to save Bioconductor data structures into programming language agnostic file artifacts, and load them back into memory. This is a more robust and portable alternative to serialization of such objects into .rds files. Each artifact is associated with metadata for further interpretation, which may be enriched with context-specific properties by downstream applications. Notable derivatives of the package include the following. (See next section for more details on these classes.)
SummarizedExperimentsSingleCellExperimentsSpatialExperimentsIn sequencing-based spatial transcriptomics data, measurements come in the form of a transcripts-by-spots count matrix, where each spot is additionally associated with spatial coordinates.
By contrast, imaging-based technologies yield molecule-level data that are typically provided as long-format tables where each row corresponds to an observation, and columns contain information about transcript identity, spatial location, and experimental metadata (e.g. sample of origin). Upon segmentation of cell boundaries and subsequent transcript-to-cell mapping, these data can be reshaped into a transcripts-by-cells count matrix that is analogous to data from single-cell technologies.
For both types of data, observations are associated with additional metadata such as area size of spots or of segmented cells and, for the latter, centroid locations and polygonal boundaries from segmentation.
Single-cell RNA-seq and analogous technologies quantify transcripts at single-cell resolution, yielding a transcripts-by-cells count matrix. In Bioconductor, the primary class for data from single-cell experiments is SingleCellExperiment (Amezquita et al. 2020) (SCE).
SCE extends the SummarizedExperiment (SE) class by a series of characteristics specific to single-cell data. For instance, reducedDims for low-dimensional embeddings of observations such as PCA, t-SNE, and UMAP; row- and colPairs for relationships between genes (e.g. gene-to-gene correlations) and cells (e.g. cell-to-cell distances), respectively; and, data on alternative features from the same cells, such as those obtained via multi-modal assays, are stored as altExps (for “alternative experiments”).
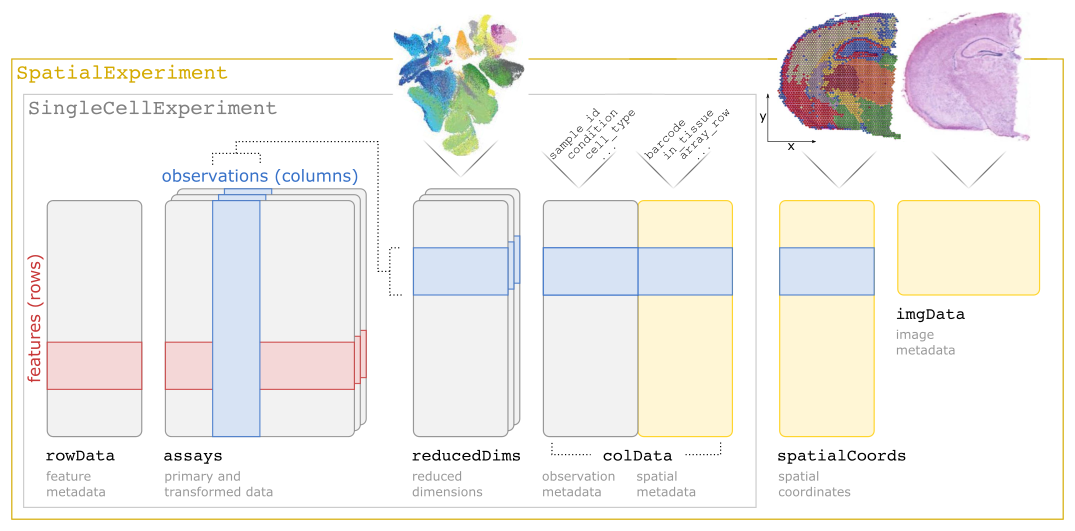
SpatialExperiment (SPE) (Righelli et al. 2022) is the core data class used in this book. This class allows us to store datasets at the spot or cell level, i.e. data from sequencing-based platforms at the spot level, or data from imaging-based platforms aggregated to the cell level.
SPE extends SCE with additional customizations to store spatial information, such as spatial coordinates and image files. A schematic of the SpatialExperiment object structure is shown in Figure 4.1. Briefly, a SPE object consists of (i) assays containing expression counts, (ii) rowData containing information on features, i.e. genes, (iii) colData containing information on spots or cells, including non-spatial and spatial metadata, (iv) spatialCoords containing spatial coordinates, and (v) imgData containing image data. For spot-based data, a single assay named counts is used.
SpatialExperiment data class for storing and manipulating spatial transcriptomics datasets within the Bioconductor framework.
SPE has been extended through SpatialFeatureExperiment (SFE) (Moses et al. 2023), which can additionally accommodate observation- and feature-level graphs (e.g. of cell/spot neighborhoods) and geometries (e.g. segmentation and tissue boundaries, or histological regions annotated by a pathologist). Because these are represented as sf (geometries) and spdep (graphs) objects (Pebesma 2018; Pebesma and Bivand 2005), SFE directly gives access to a range of geometry operations (e.g. intersecting and buffering) and spatial dependency calculations (e.g. Moran’s I and Geary’s C).
MoleculeExperiment (ME) (Peters Couto et al. 2023) is an extension to SPE designed for imaging-based spatial transcriptomics data. For each sample, ME stores a list of molecules (e.g. transcript identities and coordinates), and boundaries (e.g. cell identities and polygon coordinates). The latter can, in principle, contain alternative segmentations that may stem from, e.g., cell membrane, body, or nucleus stainings. In this way, different count matrices may be obtained by allocating molecules to a given set of boundaries. Analyses at the aggregated cell level may, in turn, be carried out using an ME-derived SPE (the ME package provides a wrapper for this).
There are several other frameworks outside Bioconductor that support spatially-aware analysis for both sequencing- and imaging-based platforms.
In particular, Seurat (Hao et al. 2023) and Scanpy (Wolf et al. 2018) provide comprehensive single-cell analysis pipelines in R and Python, respectively, and incorporate features to visualize and analyze spatial omics datasets. Scanpy and other Python/scverse tools use AnnData as a core class for storing annotated single-cell and spatial data. Packages including Giotto (Chen et al. 2025; Dries et al. 2021) and VoltRon (Manukyan et al. 2023) (R), as well as Squidpy (Palla et al. 2022) (Python) support all-in-one frameworks for analyzing spatial omics data and contain extensive sets of spatially-aware algorithms.
Giotto (or Giotto Suite) (Chen et al. 2025; Dries et al. 2021) provides tools to process, analyze and visualize spatial multi-omics data at multiple scales and resolutions. The package supports the analysis of an extensive set of sequencing- and imaging-based platforms with either transcriptomics and proteomics modalities such as Xenium, Visium HD, and CODEX (Akoya). Giotto provides utilities to manipulate spatial objects and images, detect spatial patterns and spatially-aware clusters, and supports database-based backend data using dbverse for scalability.
The Giotto classes documentation describes the R classes used to store spatial omics data within the Giotto framework.
The VoltRon (Manukyan et al. 2023) package incorporates a framework that allows spatially-aware alignment between datasets with observations that span across regions of interest (ROIs) and image tiles in addition to cells, spots, and molecules. Shiny applications are provided to conduct both automated and manual spatial alignment across adjacent tissue sections where users can interactively manage images and choose landmark points for co-registration. VoltRon is also an end-to-end spatial omics analysis package, and supports on-disk representations of spatially-resolved datasets using .zarr and .h5 backed DelayedArray objects.
spatialGE (Ospina et al. 2022) relies on a custom class (STlist) to store data and results from multiple tissue sections. The framework includes methods for visualization, spatial autocorrelation, tissue domain/niche detection, spatial gene set enrichment, spatial gene expression gradients, spatially-aware differential gene expression, etc. spatialGE also provides a point-and-click web application that allows for use without coding/scripting.
The SpatialData (Marconato et al. 2025) framework (Figure 4.2) offers a suite of modules for loading, handling, as well as (static and interactive) visualization of diverse spatial omics data (spanning imaging- and sequencing-based data and different modalities).
The container relies on 5 types of elements (images, labels, shapes, points, and tables), which are represented on-disk using standardized, OME-NGFF compliant file formats (.zarr for images, labels, and tables; .parquet for shapes and polygons), enabling unified and memory-efficient data representation and handling.
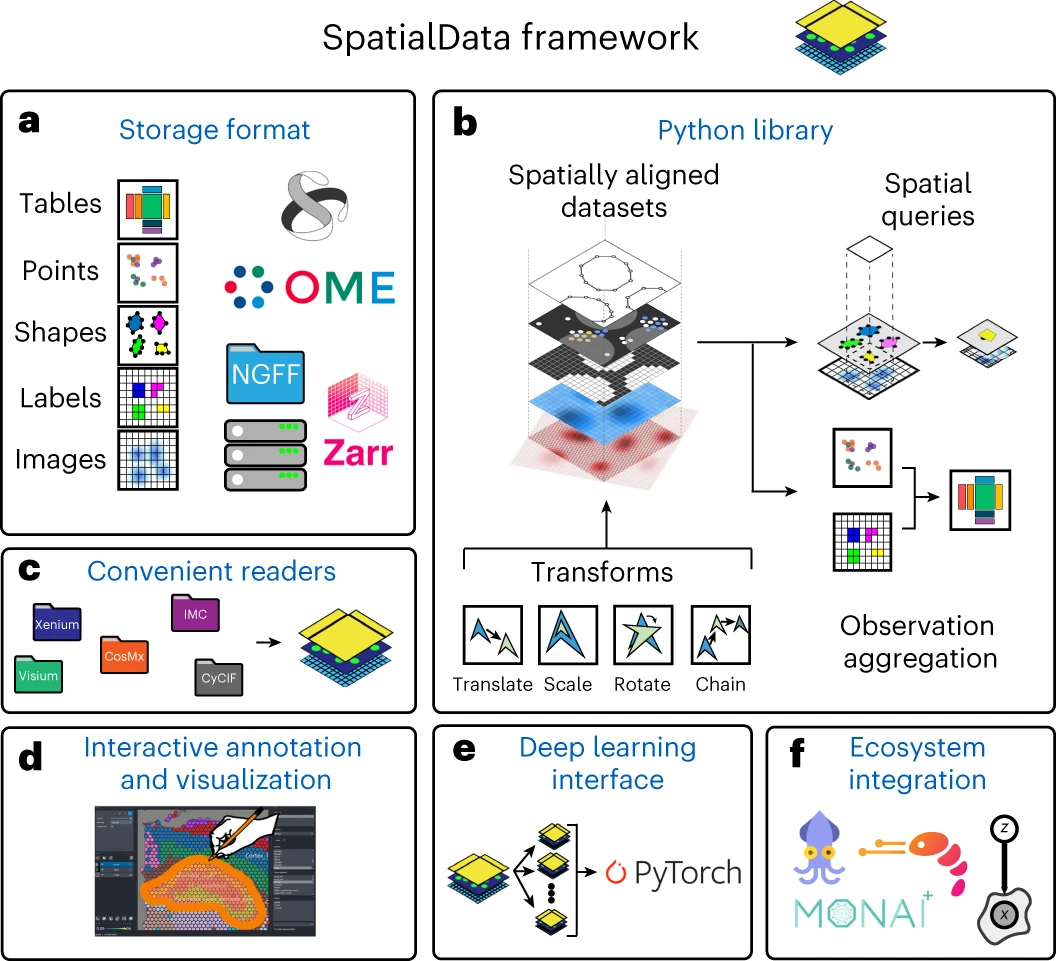
SpatialData framework.
Bruker’s AtoMx is a cloud-based platform for both interactive visualization and GUI-based analysis. AtoMx can execute pipelines built from both custom and pre-configured modules, and incorporates Bruker’s multi-modal segmentation algorithm. The platform is integrated with CosMx SMI instruments, so data is available through AtoMx upon acquisition.
10x Genomics’s Loupe Browser is a visualization software application for Visium, Visium HD, and other single-cell and multiome data by 10x Genomics. The complementary loupeR package allows for coercion of Seurat objects (and, in turn, Bioconductor’s SummarizedExperiment derived classes) into Loupe Browser-compliant files. Histopathological annotation of CytAssist images is also supported.
10x Genomics’s Xenium Explorer is a desktop application (for Mac and Windows) that enables interactive visualization; can incorporate third-party results (e.g. cell metadata, other segmentations); annotating and exporting regions of interest; and, registering post-Xenium images. The application is limited to data generated by the Xenium Analyzer instrument.
Vizgen’s Visualizer software is included with the MERSCOPE instrument purchase. It allows for interactive visualization of segmentation boundaries, transcripts, and proteins; can incorporate external analysis results (e.g. clustering, dimensionality reduction); and, supports annotating and exporting regions of interest for downstream analysis.
napari (Sofroniew et al. 2025) is a fast, interactive, multi-dimensional image viewer for Python, which is designed for browsing, annotating, and analyzing large multi-dimensional images. It is built on top of Qt (for the GUI), vispy (for performant GPU-based rendering), and the scientific Python stack (numpy, scipy).
iSEE (Rue-Albrecht et al. 2018), for “Interactive SummarizedExperiment (SE) Explorer”, is not (yet) designed for spatial data, but provides a Shiny-based interface to visualize SE and SE-derived objects, which includes SingleCellExperiment and Spatial(Feature)Experiments. iSEE pays special attention to single-cell data with visualization of dimensionality reduction results, so that spatial coordinates could be stored as a reducedDim entry to render spatial plots. There is support for:
napari-cosmx plugin.