9 Introduction
9.1 Introduction to sequencing-based ST
Sequencing-based spatial transcriptomics (ST) platforms combine high-throughput gene expression profiling from high-throughput sequencing assays with spatial information derived from unique barcodes that are location-specific. Thus, gene expression patterns can be profiled while retaining spatial arrangement.
Several steps are involved, including tissue preparation, RNA capture, reverse transcription, and high-throughput sequencing. Bioinformatically, reads are mapped to reference transcriptomes (or annotated genomes) and reads are further parsed to determine their original spatial origin.
The remainder of this part follows that analysis path: Chapter 10 describes the conversion from reads to count matrices, Chapter 6 covers reading processed platform outputs into R/Bioconductor objects, and Chapter 11 and Chapter 12 demonstrate early count-level analysis steps before the workflow chapters.
9.2 Platforms
9.2.1 10x Genomics Visium
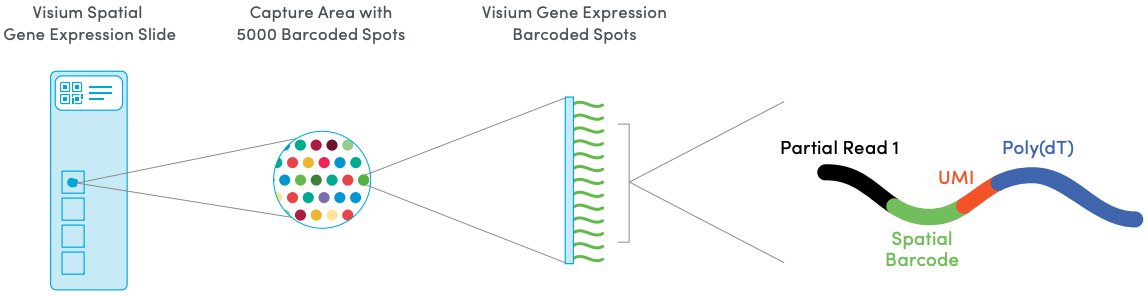
The 10x Genomics Visium platform measures transcriptome-scale gene expression at a hexagonal grid of spatial locations (referred to as spots) on a tissue capture area on a slide. Either fresh-frozen or formalin-fixed paraffin-embedded (FFPE) tissue may be used. Each spot contains millions of spatially-barcoded capture oligonucleotides, which bind to mRNAs from the tissue. A cDNA library is then generated for sequencing, which includes the spatial barcodes, allowing reads to be mapped back to their spatial locations.
The array dimensions are 6.5 x 6.5 mm, with around 5000 barcoded spots. Spots are 55 µm in diameter and spaced 100 µm center-to-center in a hexagonal (honeycomb) grid arrangement. The number of cells overlapping with each spot depends on the tissue cell density, e.g. around 0-10 for human brain tissue or ~50 for mouse brain tissue. Each Visium slide contains four tissue capture areas. The following figure provides an illustration.
Histology images generated from hematoxylin and eosin (H&E) staining can be used to identify anatomical and cell morphological features for each sample, including the number of cells per spot.
An earlier version of the platform was originally developed by Ståhl et al. (2016), which was subsequently improved and commercialized as the 10x Genomics Visium platform.
The Visium CytAssist instrument provides streamlined experimental procedures, making the platform more accessible to new research labs.
9.2.2 10x Genomics Visium HD
The 10x Genomics Visium HD platform provides higher spatial resolution. Capture area dimensions are 6.5 x 6.5 mm, with a continuous “lawn” of capture oligonucleotides arranged into a grid of 2 x 2 µm barcoded squares, which can be aggregated into 8 x 8 µm and 16 x 16 µm bins, or cells based on cell boundary polygon coordinates (e.g. using methods such as Bin2cell (Polański et al. 2024)) for downstream analyses. There are no gaps between the grid squares, and there are two capture areas per slide.
The high spatial resolution of the barcoded squares provides near-single-cell resolution, while the use of sequencing provides transcriptome-scale gene coverage. With its higher resolution and data coverage, increased sparsity is expected. Therefore, new computational challenges, such as quality control, imputation and denoising techniques, and longer computational time, should be considered when performing the analysis.
A paper describing the platform and its application to human colorectal cancer samples is available from 10x Genomics (de Oliveira et al. 2025).
9.2.3 Curio Seeker
The Curio Seeker platform is a commercially available implementation and extension of the Slide-seqV2 platform originally developed by Stickels et al. (2021).
The Curio Seeker platform captures mRNA molecules at a set of randomly placed spatial measurement locations (referred to as “beads”) on a tissue slide (referred to as a “tile”) at high spatial resolution. The tile dimensions are 3 mm x 3 mm, and the spatial resolution consists of tightly packed 10 µm diameter beads.
9.2.4 STOmics Stereo-seq
The STOmics Stereo-seq platform provides a large field of view and high spatial resolution. Chip sizes are currently available in either 5 mm x 5 mm or 10 mm x 10 mm sizes, with customized larger sizes also possible, making it possible to measure transcriptome-scale expression across large continuous tissue areas. The high spatial resolution of 500 nm enables both cellular and subcellular-level analyses.
9.3 Appendix
Resources
Datasets available from commercial providers of the platforms:
- 10x Genomics (includes Visium and Visium HD)
References
de Oliveira, Michelli Faria, Juan Pablo Romero, Meii Chung, et al. 2025. “High-Definition Spatial Transcriptomic Profiling of Immune Cell Populations in Colorectal Cancer.” Nature Genetics 57: 1512–23. https://doi.org/10.1038/s41588-025-02193-3.
Polański, Krzysztof, Raquel Bartolomé-Casado, Ioannis Sarropoulos, et al. 2024. “Bin2cell Reconstructs Cells from High Resolution Visium HD Data.” Bioinformatics 40 (btae546, 9). https://doi.org/10.1093/bioinformatics/btae546.
Ståhl, Patrik L., Fredrik Salmén, Sanja Vickovic, et al. 2016. “Visualization and Analysis of Gene Expression in Tissue Sections by Spatial Transcriptomics.” Science 353: 78–82. https://doi.org/10.1126/science.aaf2403.
Stickels, Robert R., Evan Murray, Pawan Kumar, et al. 2021. “Highly Sensitive Spatial Transcriptomics at Near-Cellular Resolution with Slide-seqV2.” Nature Biotechnology 39: 313–19. https://doi.org/10.1038/s41587-020-0739-1.