19 Segmentation
19.1 Introduction
Standard imaging-based ST data analysis pipelines rely on microscopy stains to estimate boundaries (e.g., nucleus or cellular membrane), and assign molecular readouts to their cell of origin. Such readouts can be discrete points (e.g., molecule locations) or continuous distributions (e.g., fluorescent intensities); for the latter, a decision with regard to summarization needs to be made (e.g., mean or median). The resulting measurement matrix of features (e.g., genes or proteins) \(\times\) observations (e.g., cells or spots) forms the basis for numerous analysis tasks.
Segmentation therefore connects several parts of the imaging-based workflow: the resulting boundaries and molecule-to-cell assignments are part of the imported data structures described in Chapter 6, segmentation quality is assessed in Chapter 20, and cell boundaries are required for many subcellular analyses in Chapter 24. For broader image-derived features, see Chapter 33.
19.2 Common algorithms
Image-based. cellpose (Stringer et al. 2021) is a deep learning-based method that utilizes a flow-based representation of cell morphology to identify and delineate cells across diverse microscopy images. It has been pre-trained on a large dataset of various cell types, allowing it to generalize well without requiring extensive parameter tuning or retraining. With a user-friendly interface, the ability to handle irregular and overlapping cells, and support for both automatic and user-assisted segmentation, Cellpose is a versatile tool widely used in biomedical imaging and quantitative cell analysis.
Hybrid. Baysor (Petukhov et al. 2022) has a CLI, and is also available as a Julia package. It takes a probabilistic approach that is based on Markov random fields (MRFs) and uses expectation-maximization (EM) for optimization. A variety of information – e.g., fluorescent stains (e.g., nuclei staining via DAPI), expression profiles from scRNA-seq reference data etc. – can be incorporated as priors. Yet, Baysor can perform segmentation using transcript information (i.e., location and identity) alone; auxiliary data has been shown to improve performance, but is optional.
Transcript-based. proseg (Jones et al. 2025) is available as a CLI and Julia package. It presents a fully unsupervised probabilistic approach, based on a cellular Potts model (CPM) simulation framework, where cell morphologies are initialized using a nuclear stain, then expanded and altered at random until they best explain the observed spatial distribution of transcripts.
19.3 Commercial solutions
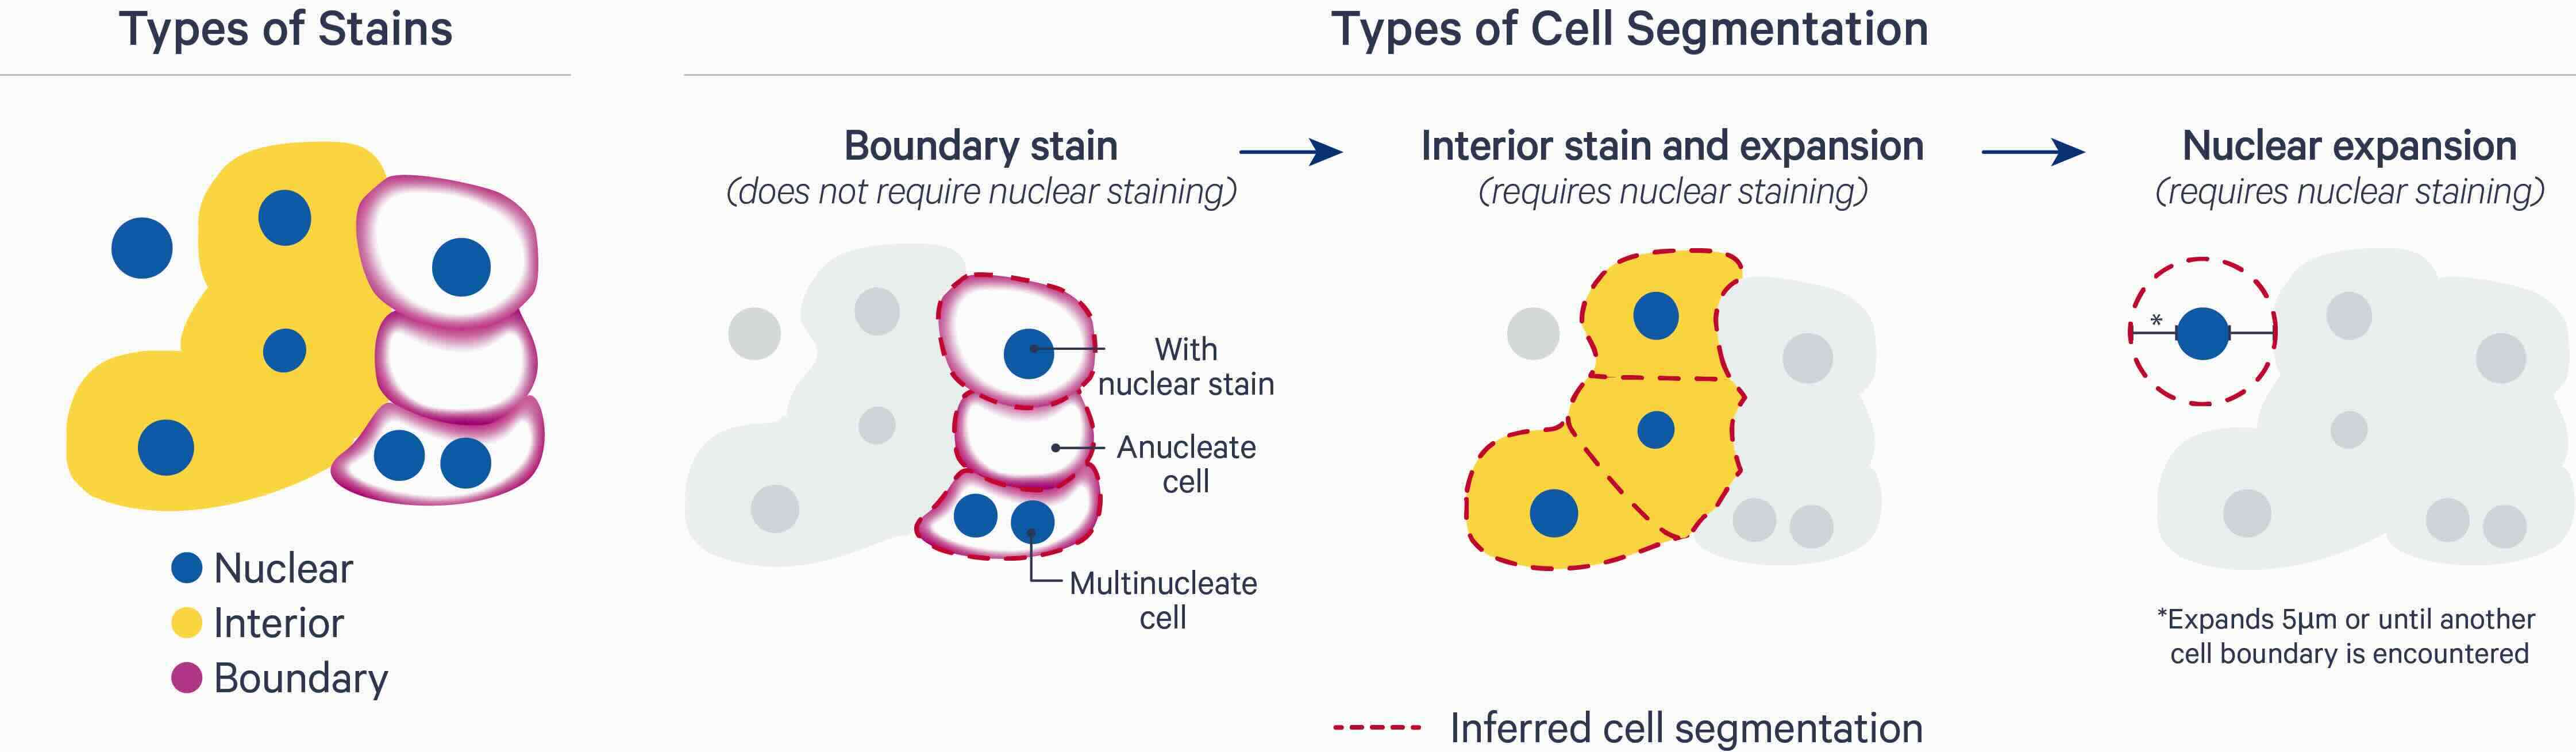
10x Genomics Xenium provides a multi-modal segmentation algorithm that is based on custom deep learning models pre-trained on Xenium data across a range of tissue types and preparations (fresh frozen, FFPE). Nuclei are first segmented based on DAPI staining. For each cell, segmentation results are then obtained in one of three ways (in order of priority): (i) cell-surface marker antibodies to target epithelia (E-Cadherin) and immune cells (CD45); (ii) nuclear expansion to the interior’s edge stain (18S rRNA); and, (iii) nuclear expansion by a fixed distance (5 µm since v2.0, previously 15 µm), or until another boundary is encountered.
19.4 Spatial bleeding
The phenomenon of spatial bleeding has been nicely characterized by Mitchel et al. (2026):
- Bleeding is most frequent above/below and close to the periphery of cells, i.e., in all physical dimensions.
- Because bleeding occurs between proximal cells, observed mixtures reflect biology (i.e., certain cell types may attract or avoid one another – in general, and especially in different spatial contexts such as healthy vs. diseased tissue regions).
- Furthermore, bleeding affects differential expression (DE), such that genes reported as up-/down-regulated may reflect compositional differences in microenvironment.
- Even ‘perfect’ 2D segmentation (in xy) would not eliminate these issues, as tissue sections represent slices through a three-dimensional system where cells may overlap (along z).
Example: genes that are DE between fibroblasts located within stromal vs. tumor regions are dominated by markers of epithelia, which represent the malignant cell type
By now, a few methods have been proposed to rectify segmentation boundaries and/or per-cell counts post hoc, e.g.:
cellAdmix (Mitchel et al. 2026) (R) relies on scRNA-seq reference-based matrix factorization of local molecular neighborhoods to identify and correct for molecular admixtures, reassigning transcripts to their source and removing them from proximal cells where they don’t belong.
SPLIT (Bilous et al. 2025) (R) relies on snRNA-seq reference-based deconvolution – using spacexr’s
RCTD(Cable et al. 2022) – to purify mixed transcriptomic signals. Briefly, deconvolution weights and reference profiles are used to proportionally adjust gene counts, prioritizing the most likely source cell type(s) and discarding or reassigning minority transcripts likely to represent contamination.FastReseg (Wu et al. 2024) (R) detects and corrects segmentation errors based on transcript locations by (i) scoring cells in terms of segmentation inaccuracies, (ii) scoring transcripts within erroneous cells in terms of misassignments, and (iii) reassigning mislocated transcripts.
segger_dev (Heidari et al. 2025) (Python) relies on graph neural networks (GNNs), where nodes represent nuclei and transcripts, and edges connect proximal instances, thereby letting the model learn from the co-occurrence of nucleic and cytoplasmic molecules.
19.5 Segmentation-free
ssam (Park et al. 2021) first estimates mRNA intensity distributions via Kernel Density Estimation (KDE) using Gaussian kernels. These are resolved to pixels, and stacked to create a gene expression vector field. The resulting representation may be used to cluster and annotate pixels, identify tissue domains (i.e., regions of homogeneous ‘cell’ type composition).
In other words, RNA target locations across the tissue are converted into a multi-channel image where each channel corresponds to one feature.

19.6 Appendix
References
Bilous, Mariia, Daria Buszta, Jonathan Bac, et al. 2025. “From transcripts to cells: Dissecting sensitivity, signal contamination, and specificity in Xenium spatial transcriptomics.” bioRxiv, ahead of print. https://doi.org/10.1101/2025.04.23.649965.
Cable, Dylan M., Evan Murray, Luli S. Zou, et al. 2022. “Robust Decomposition of Cell Type Mixtures in Spatial Transcriptomics.” Nature Biotechnology 40: 517–26. https://doi.org/10.1038/s41587-021-00830-w.
Heidari, Elyas, Andrew Moorman, Dániel Unyi, et al. 2025. “Segger: Fast and Accurate Cell Segmentation of Imaging-Based Spatial Transcriptomics Data.” bioRxiv, ahead of print. https://doi.org/10.1101/2025.03.14.643160.
Ishaque, Naveed, Peter Kharchenko, Daria Lazic, et al. 2026. “The challenge of cell segmentation in spatially resolved transcriptomics.” arXiv, ahead of print. https://doi.org/10.48550/arXiv.2606.09675.
Jones, Daniel C., Anna E. Elz, Azadeh Hadadianpour, Heeju Ryu, David R. Glass, and Evan W. Newell. 2025. “Cell Simulation as Cell Segmentation.” Nature Methods 22: 1331–42. https://doi.org/10.1038/s41592-025-02697-0.
Mitchel, Jonathan, Teng Gao, Viktor Petukhov, Eli Cole, and Peter V Kharchenko. 2026. “Impact and correction of segmentation errors in spatial transcriptomics.” Nature Genetics 58 (2): 434–44. https://doi.org/10.1038/s41588-025-02497-4.
Park, Jeongbin, Wonyl Choi, Sebastian Tiesmeyer, et al. 2021. “Cell Segmentation-Free Inference of Cell Types from in Situ Transcriptomics Data.” Nature Communications 12 (3545). https://doi.org/10.1038/s41467-021-23807-4.
Petukhov, Viktor, Rosalind J. Xu, Ruslan A. Soldatov, et al. 2022. “Cell Segmentation in Imaging-Based Spatial Transcriptomics.” Nature Biotechnology 40: 345–54. https://doi.org/10.1038/s41587-021-01044-w.
Stringer, Carsen, Tim Wang, Michalis Michaelos, and Marius Pachitariu. 2021. “Cellpose: A Generalist Algorithm for Cellular Segmentation.” Nature Methods 18: 100–106. https://doi.org/10.1038/s41592-020-01018-x.
Wu, Lidan, Joseph M. Beechem, and Patrick Danaher. 2024. “FastReseg: Using Transcript Locations to Refine Image-Based Cell Segmentation Results in Spatial Transcriptomics.” bioRxiv, ahead of print. https://doi.org/10.1101/2024.12.05.627051.