Code
imageTCGA::imageTCGA()Biomedical image analysis encompasses a wide range of imaging modalities, including computed tomography (CT) scans, magnetic resonance imaging (MRI), immunofluorescence (IF), and histological staining such as hematoxylin and eosin (H&E). In this chapter, we focus specifically on the analysis of H&E-stained histopathological images, which are routinely used in clinical diagnostics due to their low cost and ability to reveal rich morphological details.
The R and Bioconductor ecosystems offer several tools and workflows to work with digital pathology data. However, a central question remains: what constitutes the most valuable information in these images? Is it the image itself, or the biological and clinical insights that can be computationally extracted from it?
In previous chapters, spatial transcriptomics and its power in linking gene expression to tissue architecture is discussed. Here, we continue along this line by exploring how histopathological images can be leveraged to extract meaningful features that serve as input for integrative analyses in cancer research and beyond.
Histology is the study of normal tissue structure, whereas pathology focuses on identifying abnormalities in diseased tissues – both commonly rely on hematoxylin and eosin (H&E) staining to visualize cellular and tissue morphology. This is why the term histopathology is used to describe the microscopic examination of diseased tissue.
Hematoxylin and eosin (H&E) staining is one of the most widely used and cost-effective techniques in histopathology. It provides essential morphological information by staining cell nuclei (hematoxylin) and cytoplasmic or extracellular components (eosin), allowing for clear visualization of tissue architecture. Due to its low cost, high availability, and compatibility with routine clinical workflows, H&E staining is the standard first step in pathological diagnosis.
In recent years, digital pathology has enabled the large-scale acquisition and analysis of H&E-stained whole-slide images (WSIs), fostering the development of computational methods to extract quantitative features and support data-driven research in cancer and other diseases. Recent studies have demonstrated how histopathological images can be used to predict genomic alterations, transcriptional states, or even patient outcomes using machine learning (Madabhushi and Lee 2016; Schmauch et al. 2020; Bergstrom et al. 2024). Examples include HE2RNA, which predicts RNA-Seq profiles from images (Schmauch et al. 2020), and models that infer spatial transcriptomics data from histology (Pizurica et al. 2024).
Digital pathology workflows rely on high-resolution whole-slide images (WSIs) generated by proprietary scanners from different vendors. These WSIs are saved in specific file formats, each corresponding to a particular scanner type. Understanding these formats is essential for designing interoperable and reproducible computational pipelines.
The scanner brands and their respective file formats commonly encountered in digital pathology include:
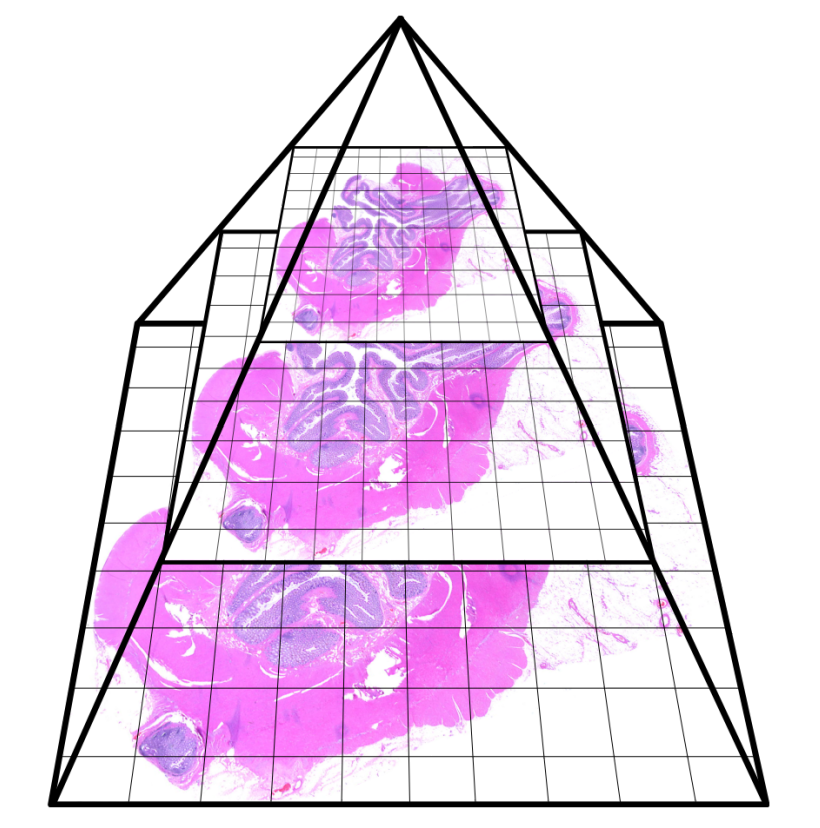
Each scanner uses a unique tiling scheme and metadata structure to support rapid visualization and efficient storage. For instance, Aperio’s .svs format uses a pyramidal tiling strategy with multiple image resolutions stored within a single file (Figure 33.1).
Several publicly available repositories, such as The Cancer Genome Atlas (TCGA) and The Cancer Imaging Archive (TCIA), provide free access to large-scale genomic and imaging datasets. In the following sections, we will explore these resources in more detail.
Immunofluorescence (IF) is a microscopy-based technique that leverages the specificity of antibodies conjugated with fluorescent dyes to visualize the distribution and abundance of target proteins within cells or tissue sections. Compared to H&E staining, which provides morphological context, IF offers molecular specificity by enabling the simultaneous detection of multiple biomarkers. This makes IF particularly powerful for studying cellular phenotypes, spatial relationships, and microenvironmental organization (Bisht et al. 2022; Miller and Shakes 1995).
In multiplex immunofluorescence (mIF) or multispectral imaging, multiple fluorophores with distinct excitation and emission spectra are used to label different antigens within the same tissue section. These methods allow for a detailed characterization of complex cellular ecosystems, such as the tumor microenvironment (TME), by quantifying the colocalization and spatial arrangement of different immune and stromal cell types. Advances in imaging technologies, such as confocal and spinning disk microscopy, as well as spectral unmixing algorithms, have further enhanced the resolution and sensitivity of IF-based analyses (Gerdes et al. 2013; Giesen et al. 2014).
The choice of markers depends on the biological question, commonly including:
Nuclear markers (e.g., DAPI) for cell nuclei visualization;
Cytoplasmic or membrane markers to identify cell types or states, such as pan-cytokeratin (PanCK) for epithelial cells or CD45 for immune cells;
Functional markers indicating proliferation (e.g., Ki-67), apoptosis, or signaling pathway activation;
TME markers to characterize immune infiltration or stromal components.
Quantitative IF image analysis typically involves several steps:
Image preprocessing, including illumination correction and background subtraction;
Segmentation, to delineate nuclei, cytoplasm, or membrane regions;
Feature extraction, capturing intensity, colocalization, and texture metrics;
Spatial analysis, to measure cell-cell interactions and neighborhood structures.
Modern open-source software platforms such as QuPath and Napari provide powerful tools for the visualization, annotation, and quantitative analysis of both H&E and IF images.
QuPath (Bankhead et al. 2017) offers user-friendly workflows for cell segmentation, marker quantification, and batch processing of large slide collections. It supports both brightfield and fluorescence imaging and can be extended through Groovy or Python scripting.
Napari (Sofroniew et al. 2025), a fast, interactive, multi-dimensional image viewer for Python, is particularly suited for high-dimensional fluorescence data. It allows plugin-based integration with analysis frameworks such as scikit-image, cellpose, and stardist, facilitating interactive and reproducible image analysis pipelines.
Together, these platforms enable the reproducible and scalable quantification of protein expression and spatial context in tissue samples, bridging the gap between classical histology and molecular imaging. The integration of IF data with transcriptomic or morphological features extracted from H&E slides holds great promise for advancing spatially resolved, multimodal studies in cancer biology.
The Cancer Genome Atlas (TCGA) includes a collection of 11,765 diagnostic whole-slide images from 9,640 patients across 33 cancer types (Tomczak et al. 2015). These histopathological images represent only one component of TCGA’s broader multi-omics repository. Alongside WSIs, TCGA provides a rich array of molecular and clinical data, including gene expression (RNA-Seq), somatic mutation profiles (whole-exome sequencing), DNA methylation, copy number alterations, protein expression (RPPA), and comprehensive clinical annotations. This multidimensional dataset facilitates integrative analyses that connect tissue morphology with molecular alterations and clinical outcomes.
TCGA includes two main types of histological slides: flash frozen and formalin-fixed paraffin-embedded (FFPE). Flash frozen slides are typically produced intraoperatively in a cryolab to help surgeons assess tumor margin status. While this method ensures close proximity to the tissue used for genomic extraction, it often introduces morphological artifacts such as tissue cracking and holes due to freezing, resulting in a “Swiss cheese” appearance that limits their utility for computational analysis.
Conversely, FFPE slides, considered the gold standard in diagnostic histopathology, are created by chemically fixing tissue in formalin and embedding it in paraffin wax before slicing. These slides preserve fine tissue architecture and provide visually high-quality samples, making them more suitable for algorithmic analysis. However, because of spatial heterogeneity in tumors, FFPE samples may not precisely correspond to the regions used for genomic profiling.
Tissue submitted to TCGA undergoes a structured workflow at the Biospecimen Core Resource (BCR). Two slides – designated top-section (TS) and bottom-section (BS) – are reviewed to evaluate tumor content and necrosis percentage. The central portion of the sample is reserved for RNA and DNA extraction. Additionally, one or more diagnostic FFPE slides are submitted to confirm histopathological diagnosis. These diagnostic slides originate from the same tumor, but the spatial and molecular correspondence to the genomics-extracted tissue is often uncertain. Thus, researchers must consider a tradeoff between image quality and genomic adjacency when designing image-based studies using TCGA data (Cooper et al. 2018).
The Cancer Imaging Archive (TCIA) is a large-scale open-access repository that provides a comprehensive collection of medical images of cancer, including radiological scans (e.g., CT, MRI, PET) and histopathological images. TCIA is a critical resource for cancer imaging research as it includes richly annotated datasets with accompanying clinical, genomic, and pathological metadata. It supports a wide range of applications, including image-based biomarker discovery, radiogenomics, and multi-modal integration studies. Researchers can access TCIA datasets through its user interface or programmatically via APIs, which facilitate the retrieval and processing of large volumes of image data in a reproducible and automated manner.
Histopathological images contain a vast amount of information, but to make them usable in computational analysis, this information needs to be translated into numerical features. Broadly speaking, two types of features can be extracted: human-interpretable features, which capture biologically meaningful descriptors, and latent embeddings, which encode complex patterns through deep learning. Together, these approaches enable both biological interpretation and powerful predictive modeling.
Human-interpretable features are designed to capture descriptors that pathologists can relate to established morphological concepts. They are typically obtained after cell or nucleus segmentation (see Chapter 19) and can be extracted using image analysis libraries such as scikit-image or Squidpy. Examples include:
These features are particularly useful when the goal is to connect image-derived measurements with biological mechanisms, as they provide an interpretable bridge between raw image data and pathology expertise.
A complementary strategy involves the use of embeddings generated by deep learning models. These models are often trained on millions of histological image tiles using self-supervised or contrastive learning, and they produce high-dimensional feature vectors that capture subtle morphological patterns not easily recognized by the human eye.
Such embeddings have been successfully applied to tasks like unsupervised clustering, patient stratification, prediction of genomic alterations, and survival analysis. For example, Prov-GigaPath (Xu et al. 2024) is a foundation model specifically developed for histopathology that provides robust and generalizable embeddings. These embeddings can be aggregated across image tiles or at the slide level and then integrated into downstream analyses.
By combining interpretable features with latent embeddings, researchers can achieve a comprehensive representation of tissue morphology: interpretable features anchor findings in biological relevance, while embeddings capture rich high-dimensional structure that enhances predictive performance.
imageTCGA is an R/Bioconductor package designed to provide an interactive Shiny application for exploring the TCGA Diagnostic Image Database. This application allows users to filter and visualize metadata, geographic distribution, and other relevant statistics related to TCGA diagnostic images.
Future updates to the package (currently under development) will also provide direct access to the features described in the previous section, allowing users to download them without additional preprocessing steps.
After installing the package from Bioconductor, you can run the Shiny application by executing the following command in R:
imageTCGA::imageTCGA()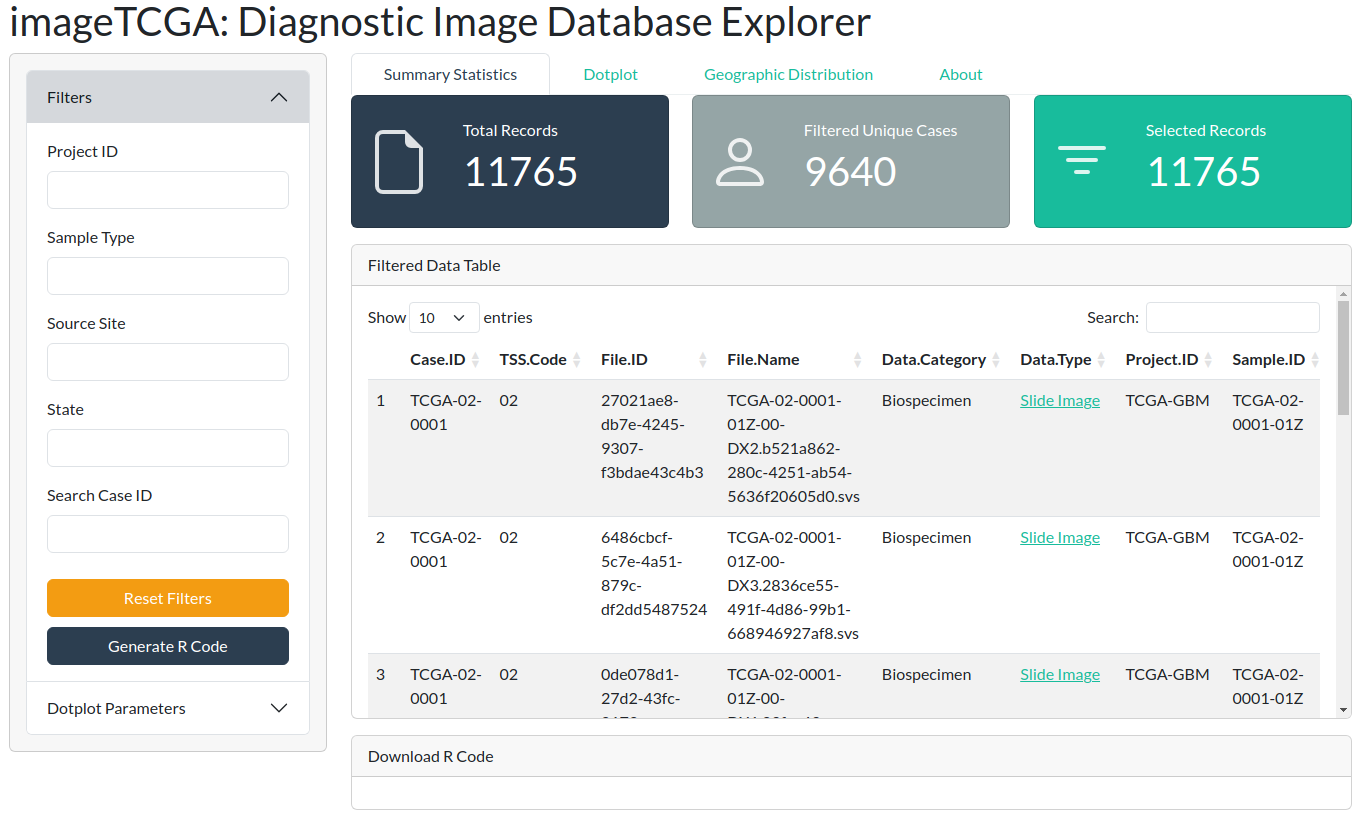
This will open the application in your default web browser, where you can explore 11,765 diagnostic images from 9,640 patients, filtering them based on various clinical and pathological parameters.
The Shiny application allows filtering by any of the available columns in the dataset. For instance, you can filter for a specific tumor type, such as ovarian cancer (107 diagnostic images).

You can generate R code to download the selected images to your local machine by clicking the blue “Generate R Code” button. This utilizes the GenomicDataCommons package.
In the example below, Ovarian Cancer images have been selected:
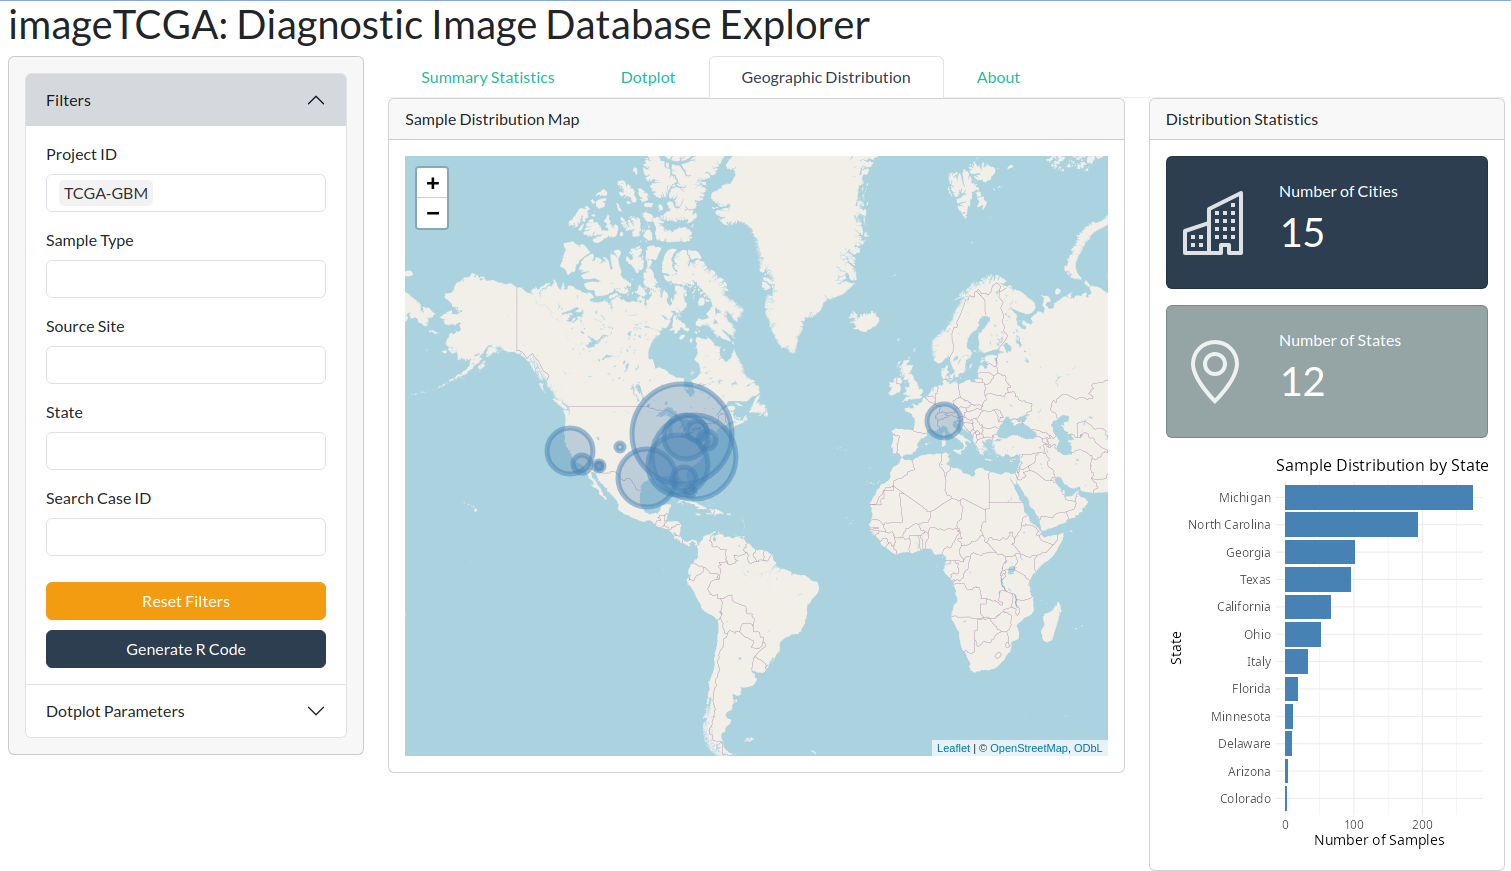
The Shiny application provides an interactive geographic visualization, displaying the origin of diagnostic images at the center, country, and state level.
For example, in the image below, GBM tumors have been selected. Additionally, summary statistics such as the number of cities and states are reported alongside a bar plot of the state distribution.
The TCIAAPI package provides an interface to the Cancer Imaging Archive (TCIA) API. The TCIA API allows users to programmatically access the TCIA data. The package provides functions to obtain an access token, download SVS images, and retrieve metadata from the TCIA API.
The TCIA API requires an access token to access the data. The tcia_access_token function retrieves the access token from the TCIA API. By default, it is configured to obtain a public token. Note that the token expires after a certain period of time and must be refreshed.
tcia_access_token() |> httr2::obfuscate()Note that we use httr2::obfuscate to hide the token from the output.
The tcia_svs_info function retrieves metadata information on SVS images from the TCIA API. The function requires a camic_id which is obtained from the ‘TCIA Histopathology Custom Dataset Builder.json’ file. The json file can be obtained by navigating to the TCIA website under ‘Access The Data’, ‘Search Histopathology Portal’ and clicking on the ‘TCIA Histopathology Custom Dataset Builder’ link.
svsinfo <- tcia_svs_info("311781")
svsinfo |> head(3L)
The tcia_svs_info function returns a list containing the metadata of the SVS including the download URL. The download URL can be used to download the SVS images.
svsinfo[["field_wsiimage"]][[1L]][["url"]]Note that currently the package does not provide a function to download the ~150 MB json file programmatically.
The tcia_svs_download function downloads SVS images from the TCIA API. Like tcia_svs_info, the function requires a camic_id, which can be obtained from the ‘TCIA Histopathology Custom Dataset Builder.json’ file.
tcia_svs_download("311781")The function downloads the SVS images to the temporary directory by default. The destdir argument can be used to specify a different directory.