3 Experimental design
3.1 Introduction
Proper experimental design is the cornerstone of any spatial omics study. Unlike bulk or single-cell RNA-seq, spatial omics adds a physical dimension that introduces unique challenges, from sampling bias to tissue artifacts.
This chapter touches on a few design considerations, including the lifecycle of a tissue sample (from biopsy to measurement), key concepts of replication, as well as strategies to guide panel and region of interest (ROI) selection.
3.2 Sample lifecycle & artifacts
The journey from a biological specimen to a digital data point involves several steps, each prone to specific artifacts.
3.2.1 Biopsy to fixation
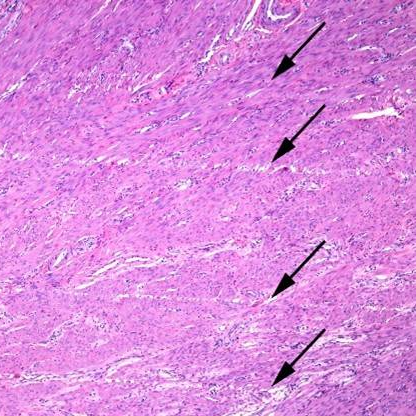
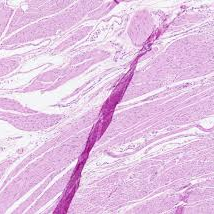
The method of tissue collection (e.g., core needle biopsy, surgical resection) can induce cellular stress responses or mechanical damage. Rapid stabilization is essential to truly preserve spatial-molecular profiles. Within minutes, delays in fixation can lead to hypoxic stress signatures that will alter molecular profiles. Physical handling can lead to mechanical damage, or “crush artifacts”. During sectioning, for instance, tissue folds or tears can create “hot spots” of aggregated biopolymers, or “cold spots” where tissue is lost. And, blade (too dull) and cut quality (uneven direction or speed) can introduce so-called “knife chatter”: parallel lines or microscopic cracks.
3.2.2 Fixation modalities: FF vs. FFPE
The choice between fixation modalities is often dictated by clinical availability and the required resolution of downstream morphology.
Fresh Frozen (FF): Generally offers higher RNA integrity and is compatible with a wider range of discovery-based assays. However, it requires strict cold chain management and often yields poorer morphological detail compared to FFPE.
Formalin-Fixed Paraffin-Embedded (FFPE) is standard for clinical pathology. Formalin fixation stabilizes the tissue and preserves morphology for years, but it also induces cross-linking and fragments the RNA. This fragmentation necessitates specialized capture methods, such as probe-based capture, to ensure sensitivity.
While FFPE blocks are often perceived as “deteriorating” over time, biological macromolecules remain remarkably stable for decades if stored at room temperature.
DNA is the most resilient, and remains stable for sequencing in blocks stored for over 40-50 years with minimal quality impact (Kokkat et al. 2013), making archival cohorts a robust resource for retrospective genomic studies.
RNA is more sensitive than DNA, yet still highly durable. High-quality whole-transcriptome data has been recovered from FFPE blocks stored for up to 20-30 years, with approximately 60% of samples yielding usable libraries (Hedegaard et al. 2014). Beyond this window, RNA-seq success rates drop as fragmentation and chemical modifications become prohibitive.
Proteins are highly stable within the paraffin matrix of an intact block for at least a decade. However, antigenicity (the ability of antibodies to bind) is the most sensitive to environmental exposure once the block is cut.
There is a critical distinction between blocks and cut slides: while blocks are stable for years, once sections are cut and placed on slides, macromolecules – especially RNA and protein antigenicity – degrade due to surface oxidation. For spatial omics, immediate use or vacuum-sealing of cut slides is essential to preserve signal intensity and, ultimately, data quality.
3.2.3 FFPE considerations
FFPE is currently the dominant clinical sample type. Due to its unique properties, specific quality control and chemistry considerations are required (Lundberg and Borner 2019; Semba and Ishimoto 2024).
3.2.3.1 Quality control: RIN vs. DV200
The traditional RNA Integrity Number (RIN) metric scores RNA quality on a scale from 1 (completely degraded) to 10 (fully intact) by analyzing the ratio of ribosomal RNA subunits via electrophoretic traces (Schroeder et al. 2006). However, because RNA is extensively fragmented in FFPE tissue, RIN is often less informative for clinical samples.
Consequently, metrics such as DV200 Index (Matsubara et al. 2020) (percentage of RNA fragments >200 nucleotides) are widely used indicators of RNA quality and are often better predictors of library success in FFPE workflows.
While these RNA integrity metrics are essential for sequencing-based ST, their relevance is reduced in imaging-based platforms that rely on targeted probe hybridization, as detection depends primarily on short hybridization regions rather than full-length transcript integrity (Ke et al. 2013; Chen et al. 2015).
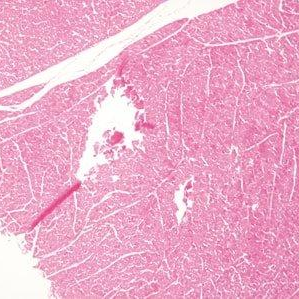
Particularly for image-based ST, histological QC is often more reliable still, using both H&E staining (assessment of cellular detail, tissue architecture, and overall histological integrity) and DAPI staining (nuclear quality assessment). Beyond this, these stains serve several practical purposes such as confirming FFPE block orientation, region of interest (ROI) selection, and identifying problematic areas such as necrosis, hemorrhage, or artifact-rich zones (see above) that could compromise molecular profiling.
3.2.3.2 Capture chemistry: poly-dT vs. probe-based
The degree of RNA fragmentation in FFPE makes traditional poly-dT capture (which targets the 3’ tail) less effective. To overcome this, many spatial platforms (e.g., 10x Genomics’ Visium) instead use probe-based chemistry. This involves hybridization of pairs of probes to specific mRNA sequences, providing significantly higher sensitivity in fragmented clinical samples.
3.3 Statistical design & power analysis
3.3.1 Replication: biological vs. technical
A robust experimental design must distinguish between biological and technical replicates. This distinction is critical for correctly estimating statistical power and ensuring that findings can be generalized to a broader population.
The goal one should have is not “I want to analyze this data.” but “I want to learn about a fundamental biological principle.” A few infamous quotes capture this sentiment well:
“We are drowning in a sea of data and starving for knowledge.” – Sydney Brenner (biologist)
“The purpose of computing is insight, not numbers.” – Richard Hamming (mathematician)
“The purpose of a model is not to fit the data but to sharpen the questions.” – Samuel Karlin (mathematician)
Biological replicates are independent samples from different biological entities (e.g., different mice or patient donors). They represent the experimental unit \(N\) that is typically reported in publications, and are used to test hypotheses about a population. Increasing \(N\) serves to better estimate within-group variability, thereby increasing the power of statistical tests to detect actual between-group differences. In other words: accounting for biological variation allows one to arrive at more generalizable findings.
Technical replicates are repeated measurements taken from the same biological unit. In spatial omics, this commonly includes serial sections taken from the same tissue block, processing the same sample across multiple slides or runs, or treating multiple cells or spots within a slice as independent.
While technical replicates increase the precision of an estimate for a specific biological unit, they do not increase the sample size \(N\) for comparing groups (e.g., wild type vs. knockout, control vs. treatment). Differences in these levels of variation can be visualized via a “replication scatter plot”, where technical replicates (e.g., adjacent slices) show tight correlation, whereas biological replicates (e.g., different donors) do not.
3.3.2 Units of analysis & pseudo-replication
Spatial runs are often processed in small batches. Randomization of samples across slides and batches is critical to avoid confounding biological signal with technical variation. In this context, understanding appropriate units of analysis is critical for both (spatial) power analysis and statistical modeling. Failing to distinguish between these units can lead to pseudo-replication, where the sample size is artificially inflated, leading to overconfident conclusions.
Biological Unit (BU) = entity of interest that provides replication for the population you wish to generalize to (e.g., mouse, human donor).
Experimental Unit (EU) = smallest entity that can be independently assigned to a treatment or experimental group; the unit of randomization. In many spatial studies, the EU is a specific tissue block.
Observational Unit (OU) = entity on which a measurement is actually taken; also called the sampling unit, this is the level at which raw data is collected. In spatial omics, the definition of an OU depends on the platform’s resolution.
The OUs for Visium, Visium HD/Stereo-seq, and CosMx/Xenium are spots, bins, and segmented cells, respectively; for all of them, the EU is an individual animal or donor. When comparing experimental conditions (e.g., healthy vs. diseased tissue), the number of independent replicates \(N\) is determined by the number of EUs (individuals), not the number of OUs (bins/spots/cells). Put differently, data on ten million cells from ten patients does not mean clinical relevance.
3.3.3 (Spatial) power analysis
In bulk and single-cell RNA-seq, traditional power analysis estimates the sample size and sequencing depth needed to reliably detect changes in expression. In spatial omics, we must also account for the spatial arrangement of cells. Spatial power analysis aims to address this additional layer of complexity, e.g., by considering the following:
Tissue architecture and “event size” should be well understood in advance. For example, the size of a typical tumor or other anatomical sites being studied such as tertiary lymphoid structures, brain layers, etc.
For imaging-based platforms, fields of view (FOVs) should fully capture spatial heterogeneity across a specimen; however, the size of FOVs and total imaging area is either fixed or limited for current commercial platforms.
Computational models can be used to simulate in silico tissue (IST), i.e., “virtual” tissue structures that can help guide experimental design in silico (that is, before an actual measurement is performed).
3.3.4 Tissue microarrays (TMAs)
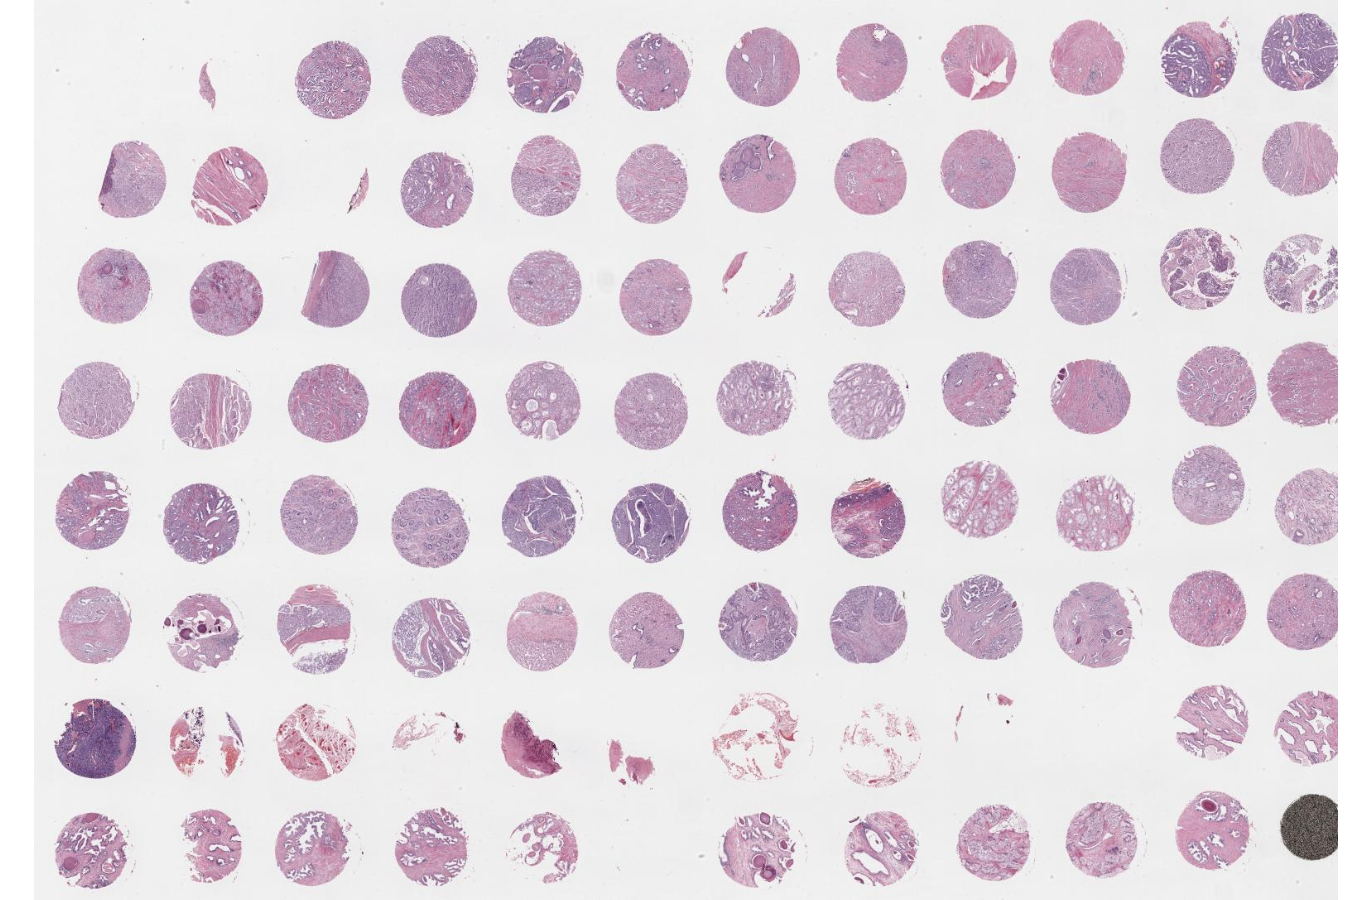
Dating back to the 90s, well before ST came to the field, TMAs have become a primary vehicle for scaling spatial studies to large-scale cohorts (Kononen et al. 1998). There are several points of note here:
TMAs allow simultaneous processing of dozens of patient cores (throughput), usually 0.6 mm to 3 mm in diameter, on a single slide. They offer a means to increase sample size while reducing intra-slide technical variability.
Then again, the primary risk of TMAs is sampling bias, where a small core (from a manual punch) may not fully capture tissue heterogeneity.
Predetermined core diameter and spacing measurements often pose another challenge: TMAs need to fit the capture area of the instrument used for downstream molecular profiling; and, sufficiently many FOVs need to be available to cover all cores (without exceeding time of cycling limitations).
It is common practice to include control tissue (such as a well-known reference, or cell line pellets) to support QC of staining or hybridization assays (e.g., IHC/ISH), to enable normalization across slides and batches, or to serve as (physical) orientation guides.
3.4 Panel design & ROI selection
3.4.1 Selecting RNA targets
For imaging-based platforms such as CosMx, Xenium, and MERFISH, the number of molecular targets is either limited, costly to max out. This necessitates: selecting informative, yet minimal, targets (gene set selection) for which probes can be built (probe design) (Baran and Doğan 2023; Kuemmerle et al. 2024). For economic reasons, different vendors provide targeted panels designed for particular biological contexts, e.g., mouse brain tissue or human immune-oncology. These attempt to balance exploration and discovery (e.g., including common cell type markers as well as under-characterized targets to test biological hypotheses).
In addition to higher cost, higher plexity can decrease spot-calling accuracy (due to molecular crowding) and increase spatial bleeding (see also Chapter 19).
3.4.2 Selecting microdissection sites
Some technologies like Bruker’s GeoMx require pre-selecting regions of interest (ROIs) for molecular profiling. Unlike whole-tissue imaging, these platforms rely on microdissection. There are different ways to define ROIs, e.g.:
Microdissection is typically destructive. Technologies like traditional Laser Capture Microdissection (LCM) physically cut out and destroy tissue for analysis. GeoMx instead relies on UV-cleavable barcodes that are released upon UV light exposure, allowing for non-destructive “virtual” microdissection.
Segmentation based on morphology markers such as CD45 (immune) and PanCK (epithelia). This is arguably the most common approach.
Contouring by drawing concentric bands around a landmark (e.g., a tertiary lymphoid structures or blood vessel) to analyze cellular patterns and gene/protein expression as a function of distance.
Gridding into regular intervals for unbiased sampling across an area; while not based on microdissection, this is done under the hood by Xenium, CosMx, etc., through field of view (FOV) placement to image large tissue.