library(SpatialExperiment)
spe <- readRDS("spe_clustering.rds")11 Spot deconvolution
11.1 Introduction
Spot-level ST data (e.g. from the 10x Genomics Visium platform) can contain zero, one, or multiple cells per spot, depending on the spatial resolution of the platform and the tissue cell density. This characteristic of the data affects several steps in analysis workflows, including quality control (Chapter 6) and clustering (Chapter 10).
Note that this is also a characteristic of ST data that is distinct from single-cell RNA sequencing data, so here we cannot easily apply existing methods from single-cell workflows.
In this section, we will demonstrate methods to deconvolve cell types per spot.
11.2 Load previously saved data
We start by loading the previously saved data object(s) (see Section 10.4).
11.3 Number of cells per spot
The following figure provides an overview of the number of cells per spot in this dataset, which is known in this dataset and stored in a column in colData in the SpatialExperiment object. We use a visualization function from ggspavis to generate the plot.
We see that spots in this dataset contain around 0-10 cells, with a mode of 3. Therefore, it is plausible that some spots contain multiple cell types, and spot-level deconvolution could improve downstream analyses by deconvolving these cell types.
library(ggspavis)

# plot number of cells per spot
plotSpotQC(spe, plot_type = "histogram", x_metric = "cell_count") +
  xlab("number of cells") +
  ggtitle("Number of cells per spot")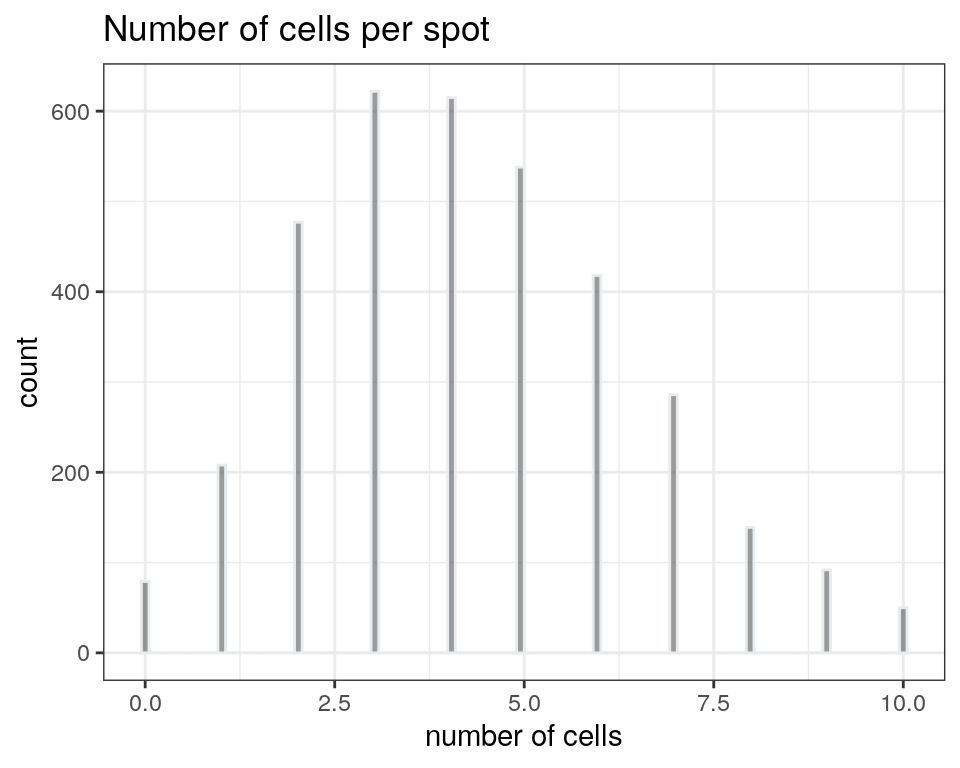
11.4 Spatial registration
Spatial registration methods use gene expression profiles for cell populations of interest from single-cell RNA sequencing data as a reference, and use these single-cell expression profiles to ‘spatially register’ the spatial coordinates of observations corresponding to these cell populations in spatial transcriptomics data.