2 Spatial transcriptomics
2.1 Introduction
Spatial transcriptomics (or spatially-resolved transcriptomics) refers to a set of recently developed technological platforms that enable the measurement of up to transcriptome-scale gene expression at spatial resolution within tissue sections. Spatial transcriptomics was named the Method of the Year 2020 by the journal Nature Methods, and has become widely applied in a range of biological contexts.
A number of technological platforms have been developed, including several that have been commercialized. Platforms differ in terms of the experimental procedures used, the number of genes or transcripts that can be identified (e.g. hundreds of genes or up to full-transcriptome), and spatial resolution (e.g. single-cell resolution or multiple cells per measurement location). In general, there is a tradeoff between the number of genes and spatial resolution.
Platforms may be grouped into “sequencing-based” and “imaging-based” (or “molecule-based”) technologies, which are described in more detail below. Sequencing-based platforms tend to provide higher gene coverage (e.g. full-transcriptome), while imaging-based platforms tend to provide higher spatial resolution (e.g. single-cell resolution).
In this book, we focus on commercially available platforms, since these are the most widely used and accessible. The main sections of the book are split into two parts for sequencing-based and imaging-based platforms, since several of the analysis techniques are distinct between the two types of data.
In this chapter, we provide some additional background on several commercially available platforms. For more in-depth background, several recent reviews are available, e.g. Bressan, Battistoni, and Hannon (2023) and Moses and Pachter (2022), which discuss available platforms, analysis methods, outstanding challenges, and additional topics.
2.2 Sequencing-based platforms
Sequencing-based platforms capture messenger RNA (mRNA) molecules at a set of spatial measurement locations on a tissue section placed on a slide, tag the mRNAs with unique spatial barcodes for each measurement location, and generate a readout by sequencing.
These platforms capture an untargeted set of genes with up to full-transcriptome coverage (i.e. >20,000 genes), due to the use of sequencing, which does not require the selection of a targeted panel of genes. Spatial resolution varies between platforms, and depends on the size and spacing between the spatial measurement locations. Depending on the spatial resolution and tissue cell density in a given biological samples, each spatial measurement location may contain zero, one, or multiple cells.
Depending on the platform, the spatial measurement locations are often referred to as “spots” or “beads”. In this book, we will generally use the terminology “spots”.
2.2.1 10x Genomics Visium
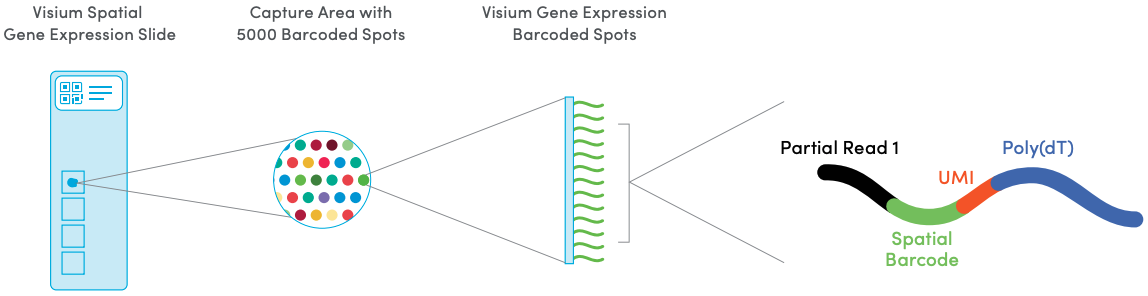
The 10x Genomics Visium platform measures transcriptome-scale gene expression at a hexagonal grid of spatial locations (referred to as spots) on a tissue capture area on a slide. Either fresh-frozen or formalin-fixed paraffin-embedded (FFPE) tissue may be used. Each spot contains millions of spatially-barcoded capture oligonucleotides, which bind to mRNAs from the tissue. A cDNA library is then generated for sequencing, which includes the spatial barcodes, allowing reads to be mapped back to their spatial locations.
The array dimensions are 6.5 x 6.5 mm, with around 5000 barcoded spots. Spots are 55 µm in diameter and spaced 100 µm center-to-center in a hexagonal grid arrangement. The number of cells overlapping with each spot depends on the tissue cell density, e.g. around 0-10 for human brain tissue or ~50 for mouse brain tissue. Each Visium slide contains four tissue capture areas. The following figure provides an illustration.
Histology images generated from hematoxylin and eosin (H&E) staining can be used to identify anatomical and cell morphological features for each sample, including the number of cells per spot.
An earlier version of the platform was developed by Ståhl et al. (2016), which was subsequently improved and commercialized as the 10x Genomics Visium platform.
2.2.2 10x Genomics Visium HD
The 10x Genomics Visium HD platform provides higher spatial resolution. Capture area dimensions are 6.5 x 6.5 mm, with a continuous “lawn” of capture oligonucleotides arranged into a grid of 2 x 2 µm barcoded squares, which are also aggregated into 8 x 8 µm and 16 x 16 µm bins for downstream analyses. There are no gaps between the grid squares, and there are two capture areas per slide. The high spatial resolution of the barcoded squares provide near-single-cell resolution, while the use of sequencing provides transcriptome-scale gene coverage.
A preprint describing the platform and its application to human colorectal cancer samples is available from 10x Genomics (Oliveira et al. 2024).
2.2.3 Curio Seeker
The Curio Seeker platform is a commercially available implementation and extension of the Slide-seqV2 platform originally developed by Stickels et al. (2021).
The Curio Seeker platform captures mRNA molecules at a set of randomly placed spatial measurement locations (referred to as “beads”) on a tissue slide (referred to as a “tile”) at high spatial resolution. The tile dimensions are 3 mm x 3 mm, and the spatial resolution consists of tightly packed 10 µm diameter beads.
2.3 Imaging-based platforms
Imaging-based platforms (also referred to as molecule-based platforms) identify the spatial locations of individual RNA molecules by sequential in situ hybridization (ISH) or in situ sequencing (ISS), for targeted sets of up to hundreds or thousands of genes, at single-cell or sub-cellular spatial resolution.
Image segmentation is used to identify the boundaries of individual cells or nuclei, and assign RNA molecules to cells or nuclei during preprocessing. For downstream analyses, gene counts may be aggregated to the cell level, or analyses may be performed directly at the molecule level. Cell-level analyses may re-use methods developed for spot-level spatial transcriptomics data or single-cell data.
The selection of targeted sets of biologically informative genes for an experiment, referred to as panel design, is a key consideration during experimental design. Several commercially available options for targeted gene sets suitable for certain biological systems are available.
2.3.1 10x Genomics Xenium
Details on the 10x Genomics Xenium platform are available from 10x Genomics.
2.3.2 Vizgen MERSCOPE
Details on the Vizgen MERSCOPE platform are available from Vizgen.
2.3.3 NanoString CosMx
Details on the NanoString CosMx platform are available from NanoString.
References
Bressan, Dario, Giorgia Battistoni, and Gregory J. Hannon. 2023. “The Dawn of Spatial Omics.” Science 381 (6657). https://doi.org/10.1126/science.abq4964.
Moses, Lambda, and Lior Pachter. 2022. “Museum of Spatial Transcriptomics.” Nature Methods 19: 534–46. https://doi.org/10.1038/s41592-022-01409-2.
Oliveira, Michelli F., Juan P. Romero, Meii Chung, Stephen Williams, Andrew D. Gottscho, Anushka Gupta, Susan E. Pilipauskas, et al. 2024. “Characterization of Immune Cell Populations in the Tumor Microenvironment of Colorectal Cancer Using High Definition Spatial Profiling.” bioRxiv. https://doi.org/10.1101/2024.06.04.597233.
Ståhl, Patrik L., Fredrik Salmén, Sanja Vickovic, Anna Lundmark, José Fernández Navarro, Jens Magnusson, Stefania Giacomello, et al. 2016. “Visualization and Analysis of Gene Expression in Tissue Sections by Spatial Transcriptomics.” Science 353 (6294): 78–82. https://doi.org/10.1126/science.aaf2403.
Stickels, Robert R., Evan Murray, Pawan Kumar, Jilong Li, Jamie L. Marshall, Daniela J. Di Bella, Paola Arlotta, Evan Z. Macosko, and Fei Chen. 2021. “Highly Sensitive Spatial Transcriptomics at Near-Cellular Resolution with Slide-seqV2.” Nature Biotechnology 39: 313–19. https://doi.org/10.1038/s41587-020-0739-1.