1 Spatially-resolved transcriptomics
Spatially-resolved transcriptomics (SRT) refers to high-throughput genomic technologies that enable the measurement of large sets of genes at a large number of spatial locations (e.g. up to thousands of genes at thousands of measurement locations), usually on two-dimensional tissue sections. A number of technological platforms have been developed, each with their unique advantages. SRT was named the Method of the Year 2020 by Nature Methods, and has found widespread application in numerous biological systems.
For recent reviews of available platforms, computational analysis methods, and outstanding challenges, see Bressan et al. 2023 or Moses et al. 2022.
1.1 Overview
In this book, we concentrate on commercially available platforms, since these are most widely used and available. Here, we provide a short overview and introductory details on the platforms used to generate the datasets discussed in this book.
1.2 Sequencing-based platforms
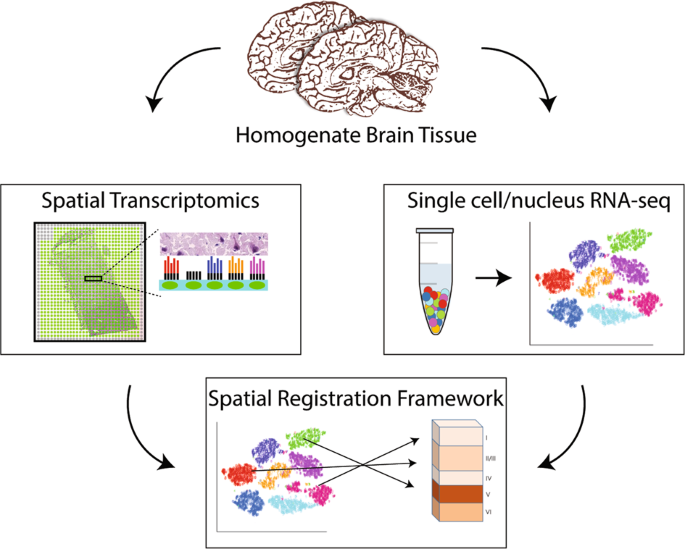
Sequencing-based platforms capture RNAs at a set of spatial measurement locations, tag RNAs with spatial barcodes, and generate a readout by next-generation sequencing.
These platforms can provide up to full-transcriptome feature resolution due to the use of next-generation sequencing. The spatial resolution depends on the size of the capture locations and tissue cell density, and may include multiple cells per measurement location.
1.2.1 10x Genomics Visium
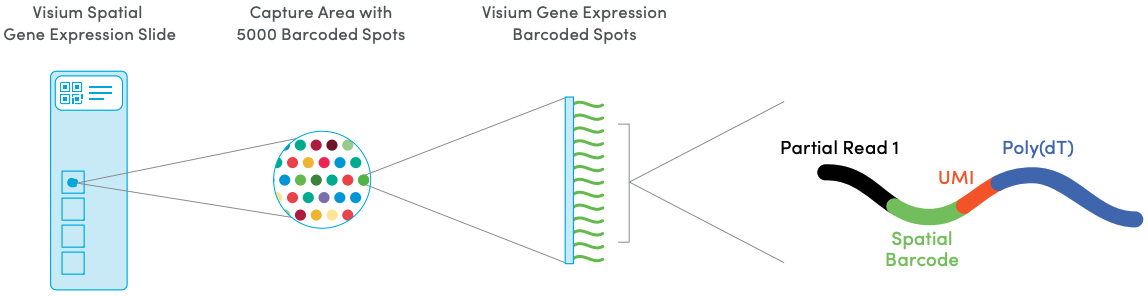
The 10x Genomics Visium platform measures transcriptome-wide gene expression at a grid of spatial locations (referred to as spots) on a tissue capture area. Either fresh-frozen or formalin-fixed paraffin-embedded (FFPE) tissue may be used. Each spot contains millions of spatially-barcoded capture oligonucleotides, which bind to mRNAs from the tissue. A cDNA library is then generated for sequencing, which includes the spatial barcodes, allowing reads to be mapped back to their spatial locations.
The array dimensions are 6.5mm x 6.5mm, with around 5000 barcoded spots. Spots are 55µm in diameter and spaced 100µm center-to-center in a hexagonal grid arrangement. The number of cells per spot depends on the tissue cell density, e.g. around 0-10 for human brain or ~50 for mouse brain. Each Visium slide contains four tissue capture areas. The following figure provides an illustration.
Histology images generated from hematoxylin and eosin (H&E) staining can be used to identify anatomical and cell morphological features such as the number of cells per spot.
1.3 Molecule-based platforms
Molecule-based platforms identify individual RNAs by in situ hybridization (ISH) or in situ sequencing (ISS) at up to sub-cellular spatial resolution. Counts may be aggregated to cellular (single-cell) spatial resolution by applying manual or data-driven cell segmentation algorithms.
Feature resolution is generally on the order of 100s to 1000s of RNAs, which may be selected as targeted panels of RNAs of interest.
1.3.1 10x Genomics Xenium
Details available on the 10x Genomics website.
1.3.2 Vizgen MERSCOPE
Details available on the Vizgen website.
1.3.3 NanoString CosMx
Details available on the NanoString website.