# LOAD DATA

library(SpatialExperiment)
library(STexampleData)
spe <- Visium_humanDLPFC()9 Spot-level deconvolution
9.1 Background
Spot-level SRT data can contain zero, one, or multiple cells per spot, depending on the tissue density and technological platform used. This characteristic of the data influences several steps in analysis pipelines, especially [Quality control] and [Clustering].
This is also a unique characteristic of SRT data, which is distinct from single-cell data, so here we cannot easily apply existing methods from single-cell pipelines.
In this section, we will demonstrate methods to deconvolve cell types per spot. Several methods exist from the bulk RNA-seq literature, as well as new methods designed for SRT data.
9.2 Previous steps
Code to run steps from the previous chapters to generate the SpatialExperiment object required for this chapter.
9.3 Number of cells per spot
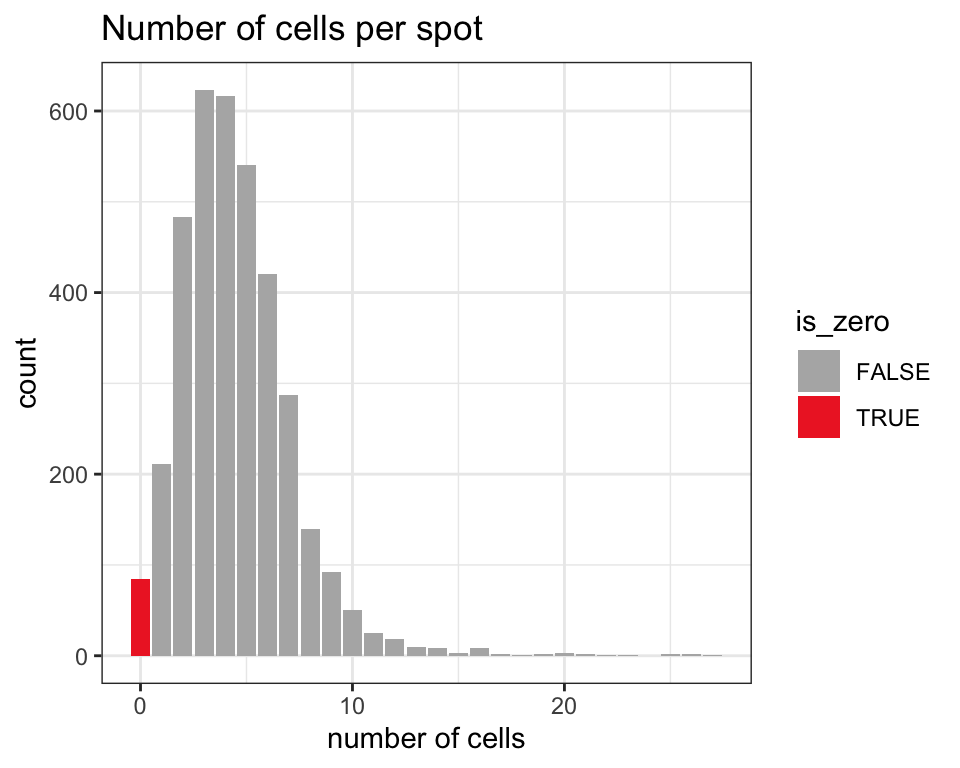
The following figure provides an overview of the number of cells per spot in this dataset, which is known in this dataset and stored in a column in colData in the SpatialExperiment object. We use a visualization function from ggspavis to generate the plot.
We see that spots in this dataset contain around 0-10 cells, with a mode of 3. Therefore, it is plausible that some spots contain multiple cell types, and spot-level deconvolution could improve downstream analyses by deconvolving these cell types.
library(ggspavis)

# plot number of cells per spot
plotQC(spe, type = "bar", metric_x = "cell_count") +
  xlab("number of cells") +
  ggtitle("Number of cells per spot")
Warning: Removed 1353 rows containing non-finite values (`stat_count()`).
Removed 1353 rows containing non-finite values (`stat_count()`).