Chapter 4 Loupe Browser
4.1 Overview
Loupe Browser is a desktop application from 10x Genomics that allows you to visualize your gene expression data without having to write code. You can utilize this software for most types of single cell transcriptomic data generated from 10x protocols, however we will discuss specifically how to use it for data generated from the Visium Spatial Gene Expression protocol. In general, you can use the Loupe Browser to align gene expression spots to histology images, look for marker gene expression, annotate populations, and cluster with three different clustering methods.
Here is a tutorial from 10x Genomics on how to use the Loupe Browser.
4.2 Manual alignment of images
One of the crucial first steps for processing Visium data is to align the gene expression spots to a high resolution image of the tissue, which in some cases can be at 40x magnification. While Space Ranger can do this automatically, if you want to ensure a high quality alignment with no mistakes it is best to do this manually in the Loupe browser. First, you upload the image and enter the serial number for the slide.
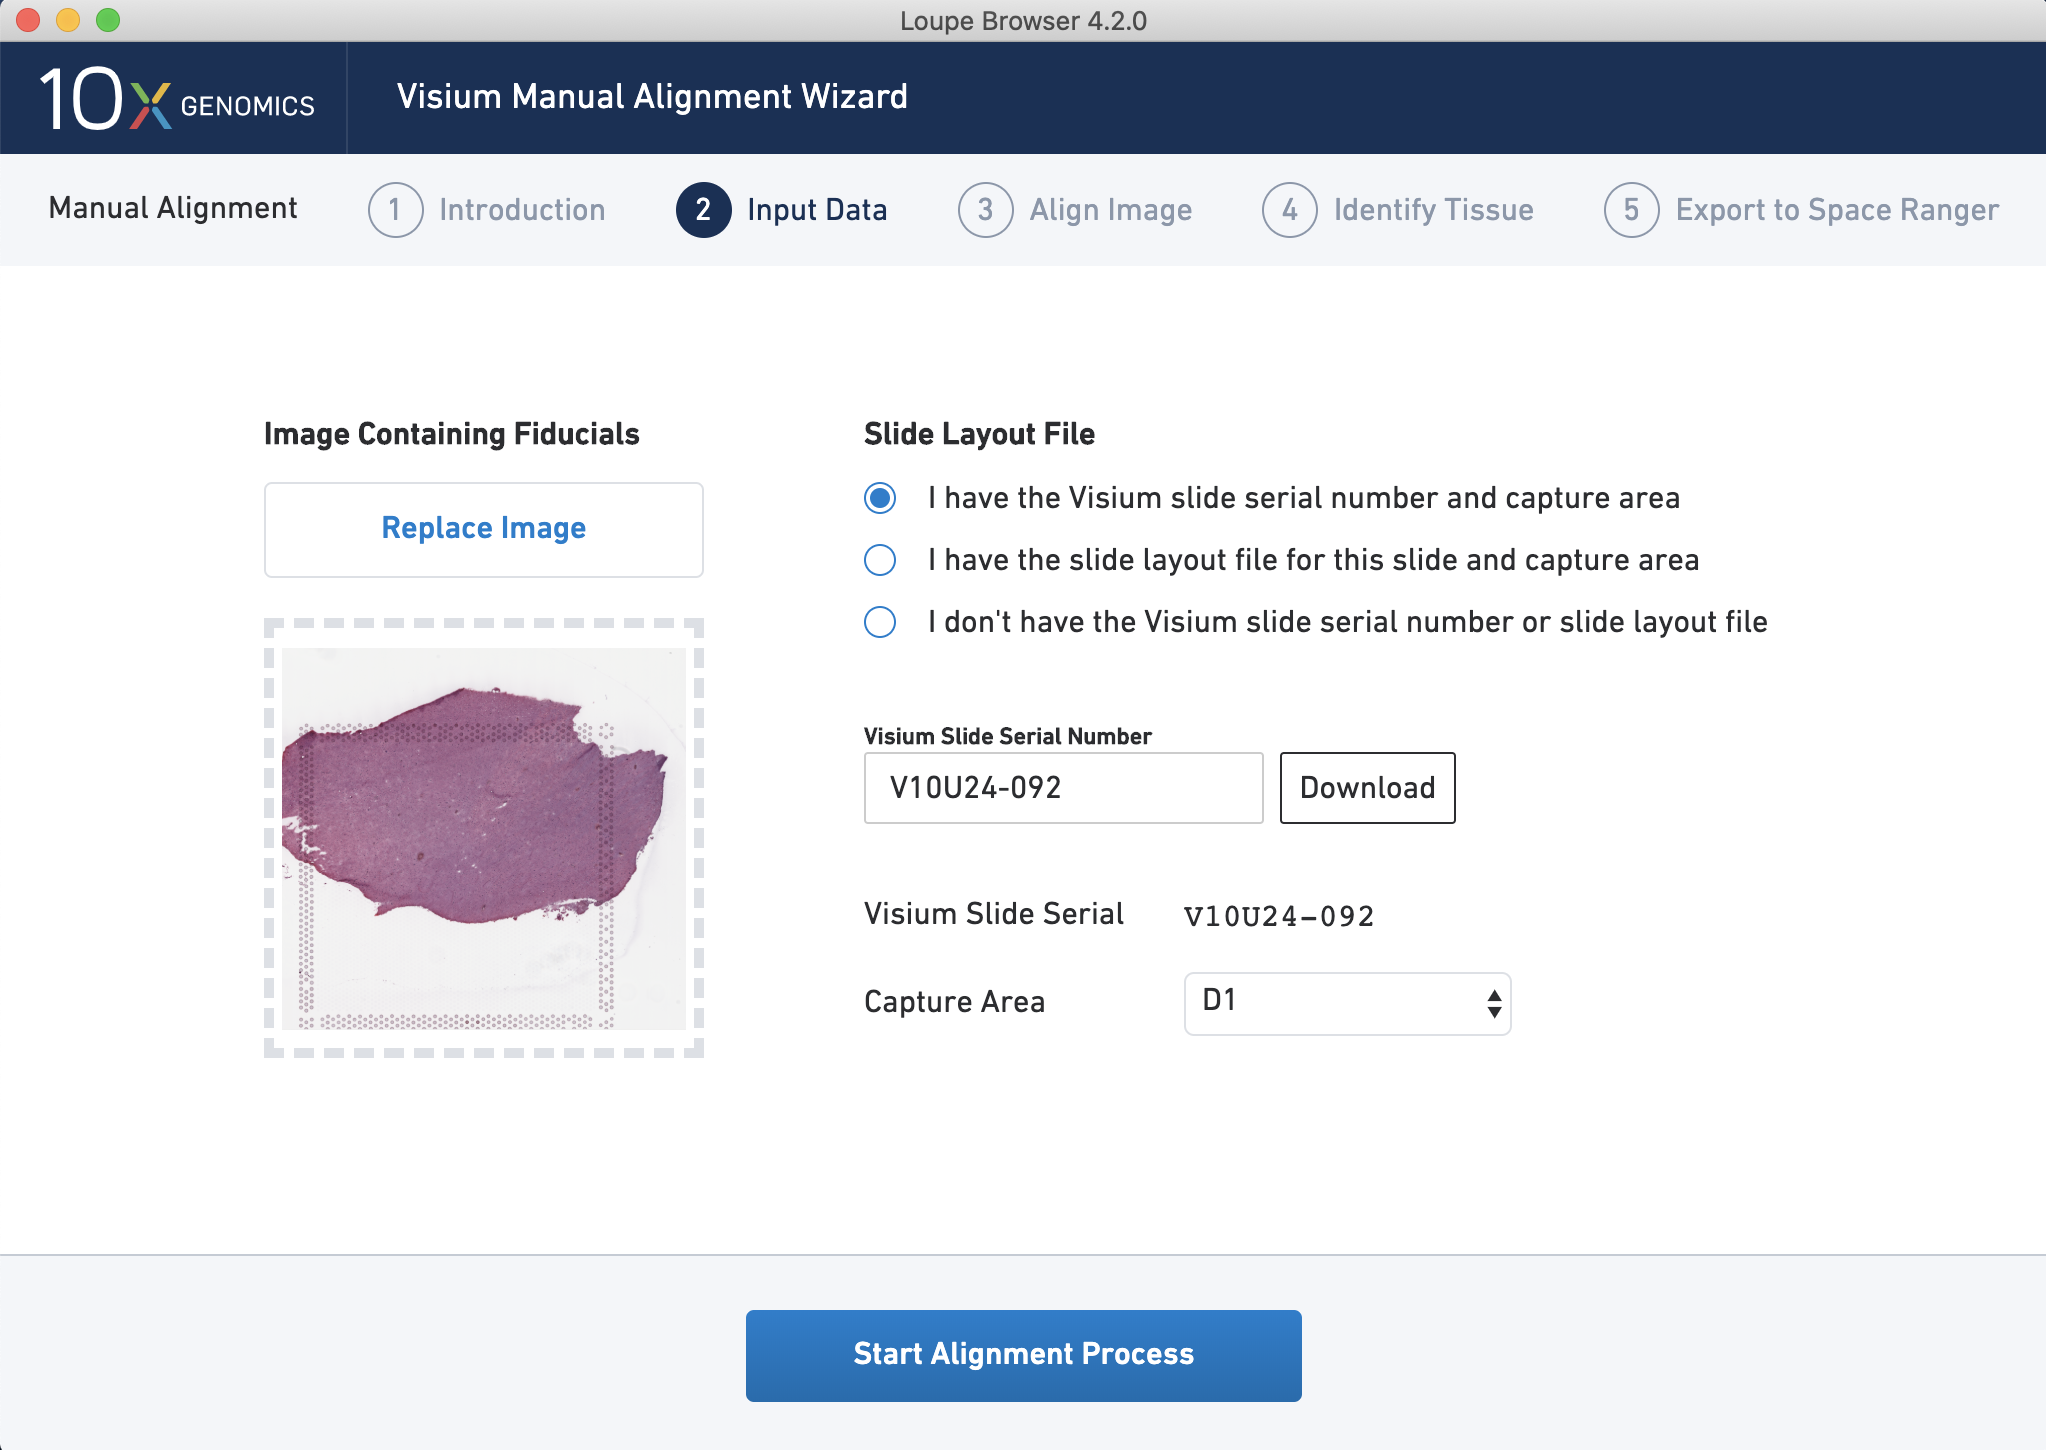
Figure 4.1: Input your Visium Slide Serial Number and select your input image to start the alignment process using Loupe by 10x Genomics.
Then, you align the fiducial frame such that the red circles are visibly aligned with the fiducial frame pattern of spots.
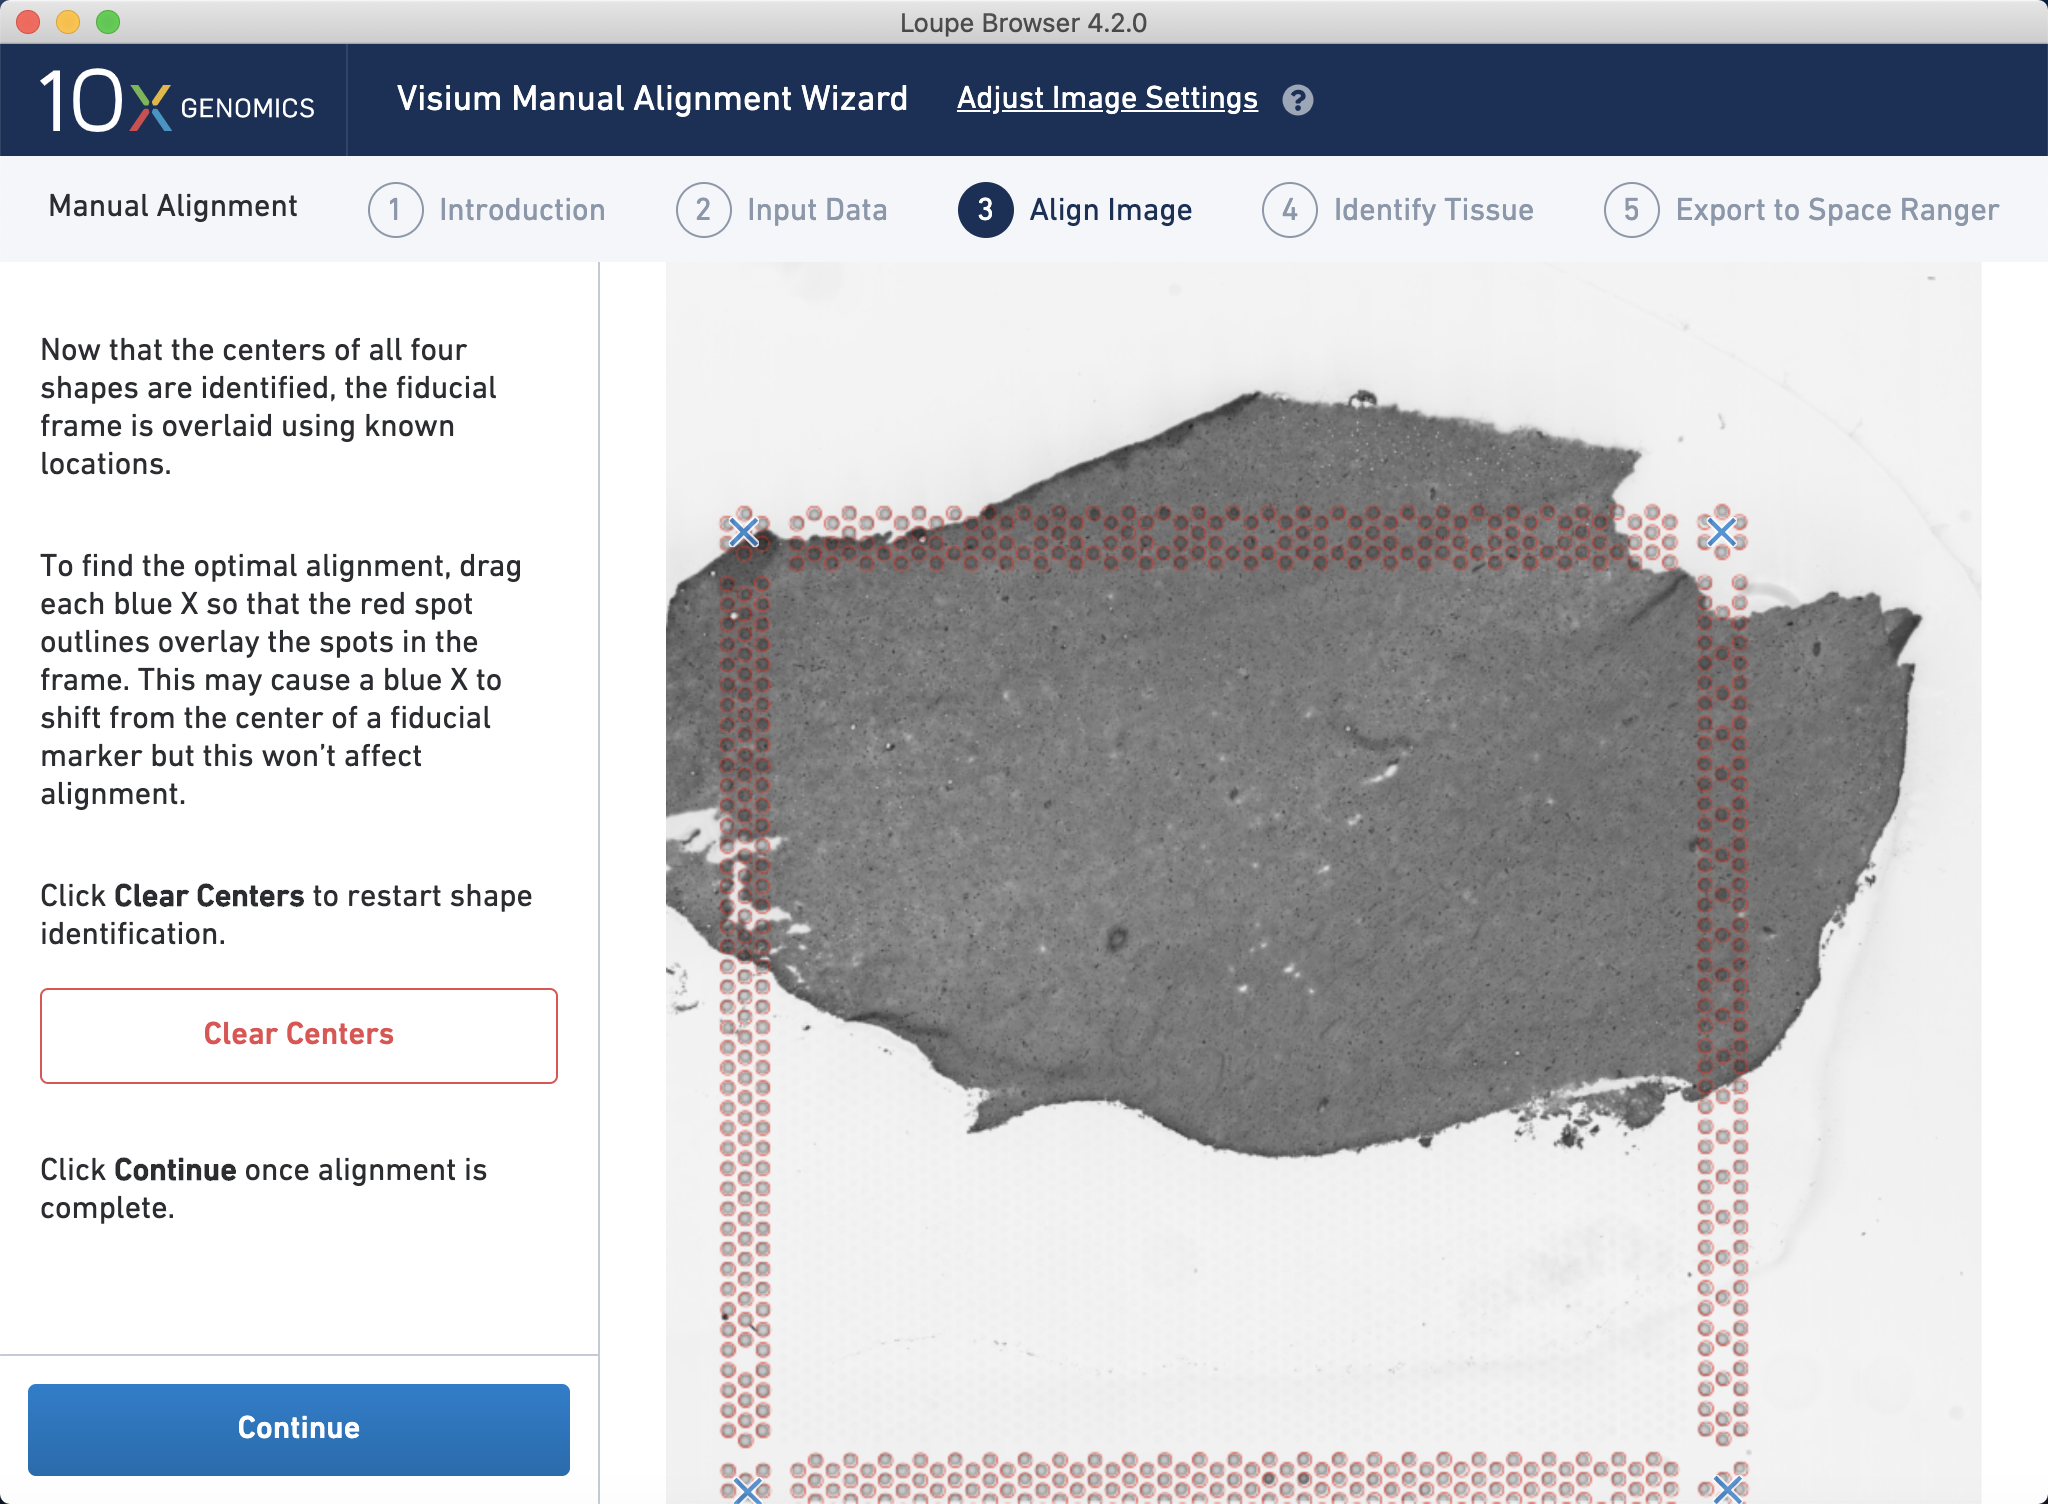
Figure 4.2: Visual alignment of the Visium fiducial frame to the bright field histology image using Loupe by 10x Genomics.
Then, you manually select the spots that contain tissue by drawing a contour line. This information will be used later on to determine which spots overlap tissue and which do not, e.g. when creating a SpatialExperiment or other data object in R or Python.
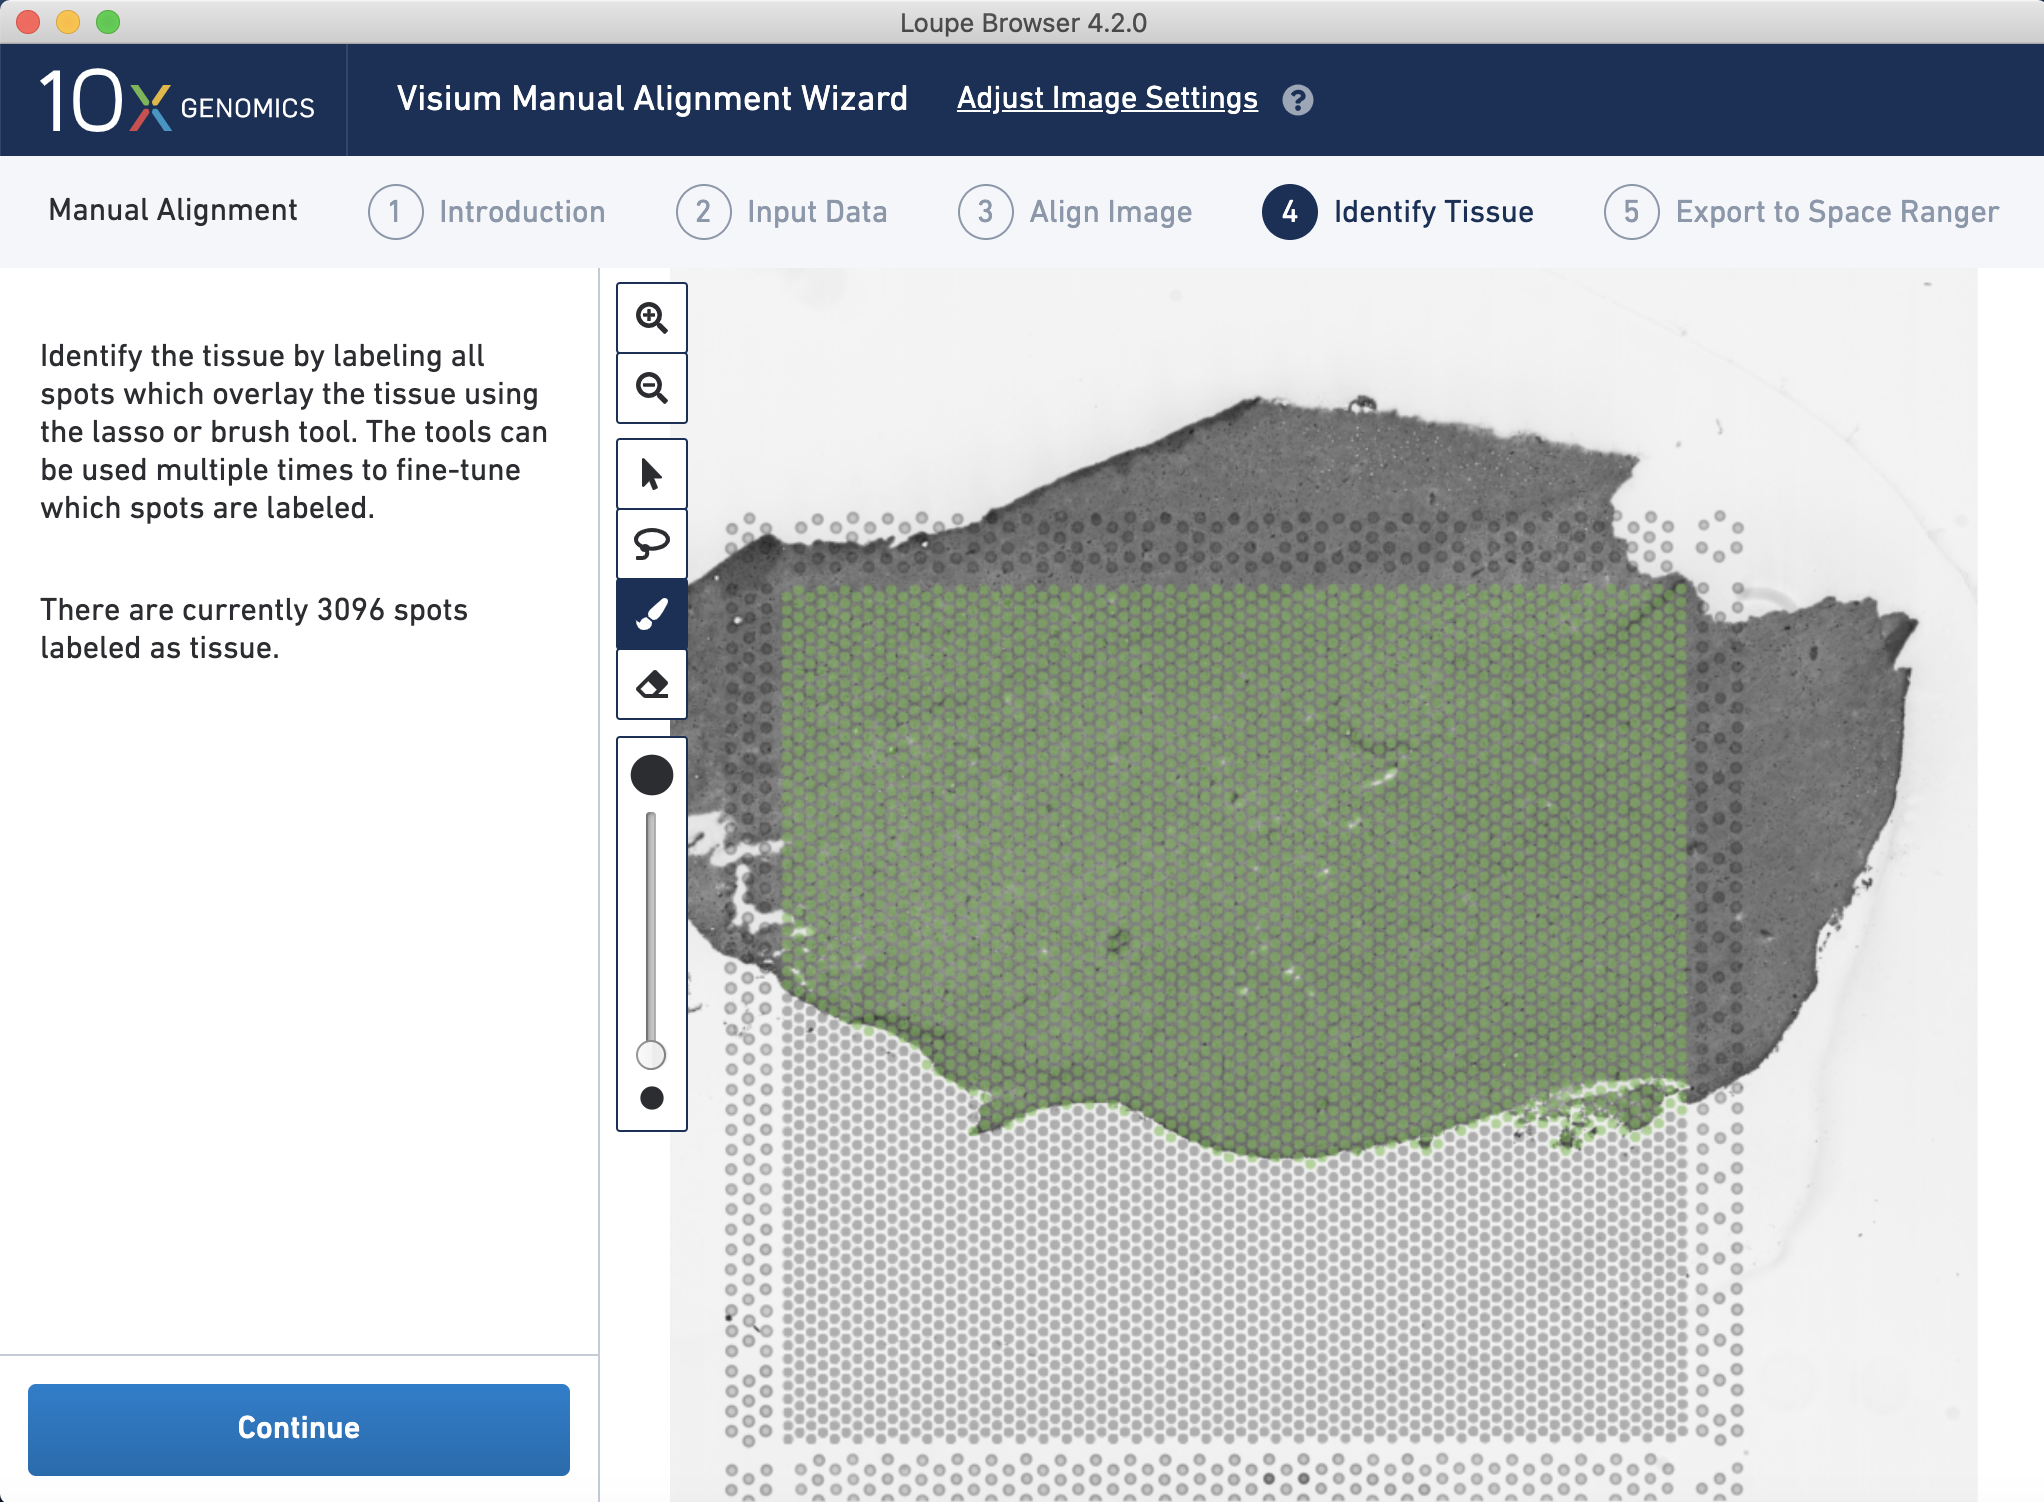
Figure 4.3: Manual selection of the Visium spots that overlap tissue based on the selected alignemnt between the image and the Visium slide fiducial frame.
4.3 Output files and Space Ranger
The output files from Space Ranger are detailed in the Space Ranger chapter of this book. The .cloupe file is the one you need to import into the Loupe Browser in order to explore your processed data. These files are generally between 1 and 2 GB each.
4.4 Downstream analyses in Loupe Browser
After running Space Ranger, you can open the .cloupe file with Loupe and visually inspect the dimensionality reduction of the data through either a t-SNE or UMAP as well as apply graph-based or k-means clustering.
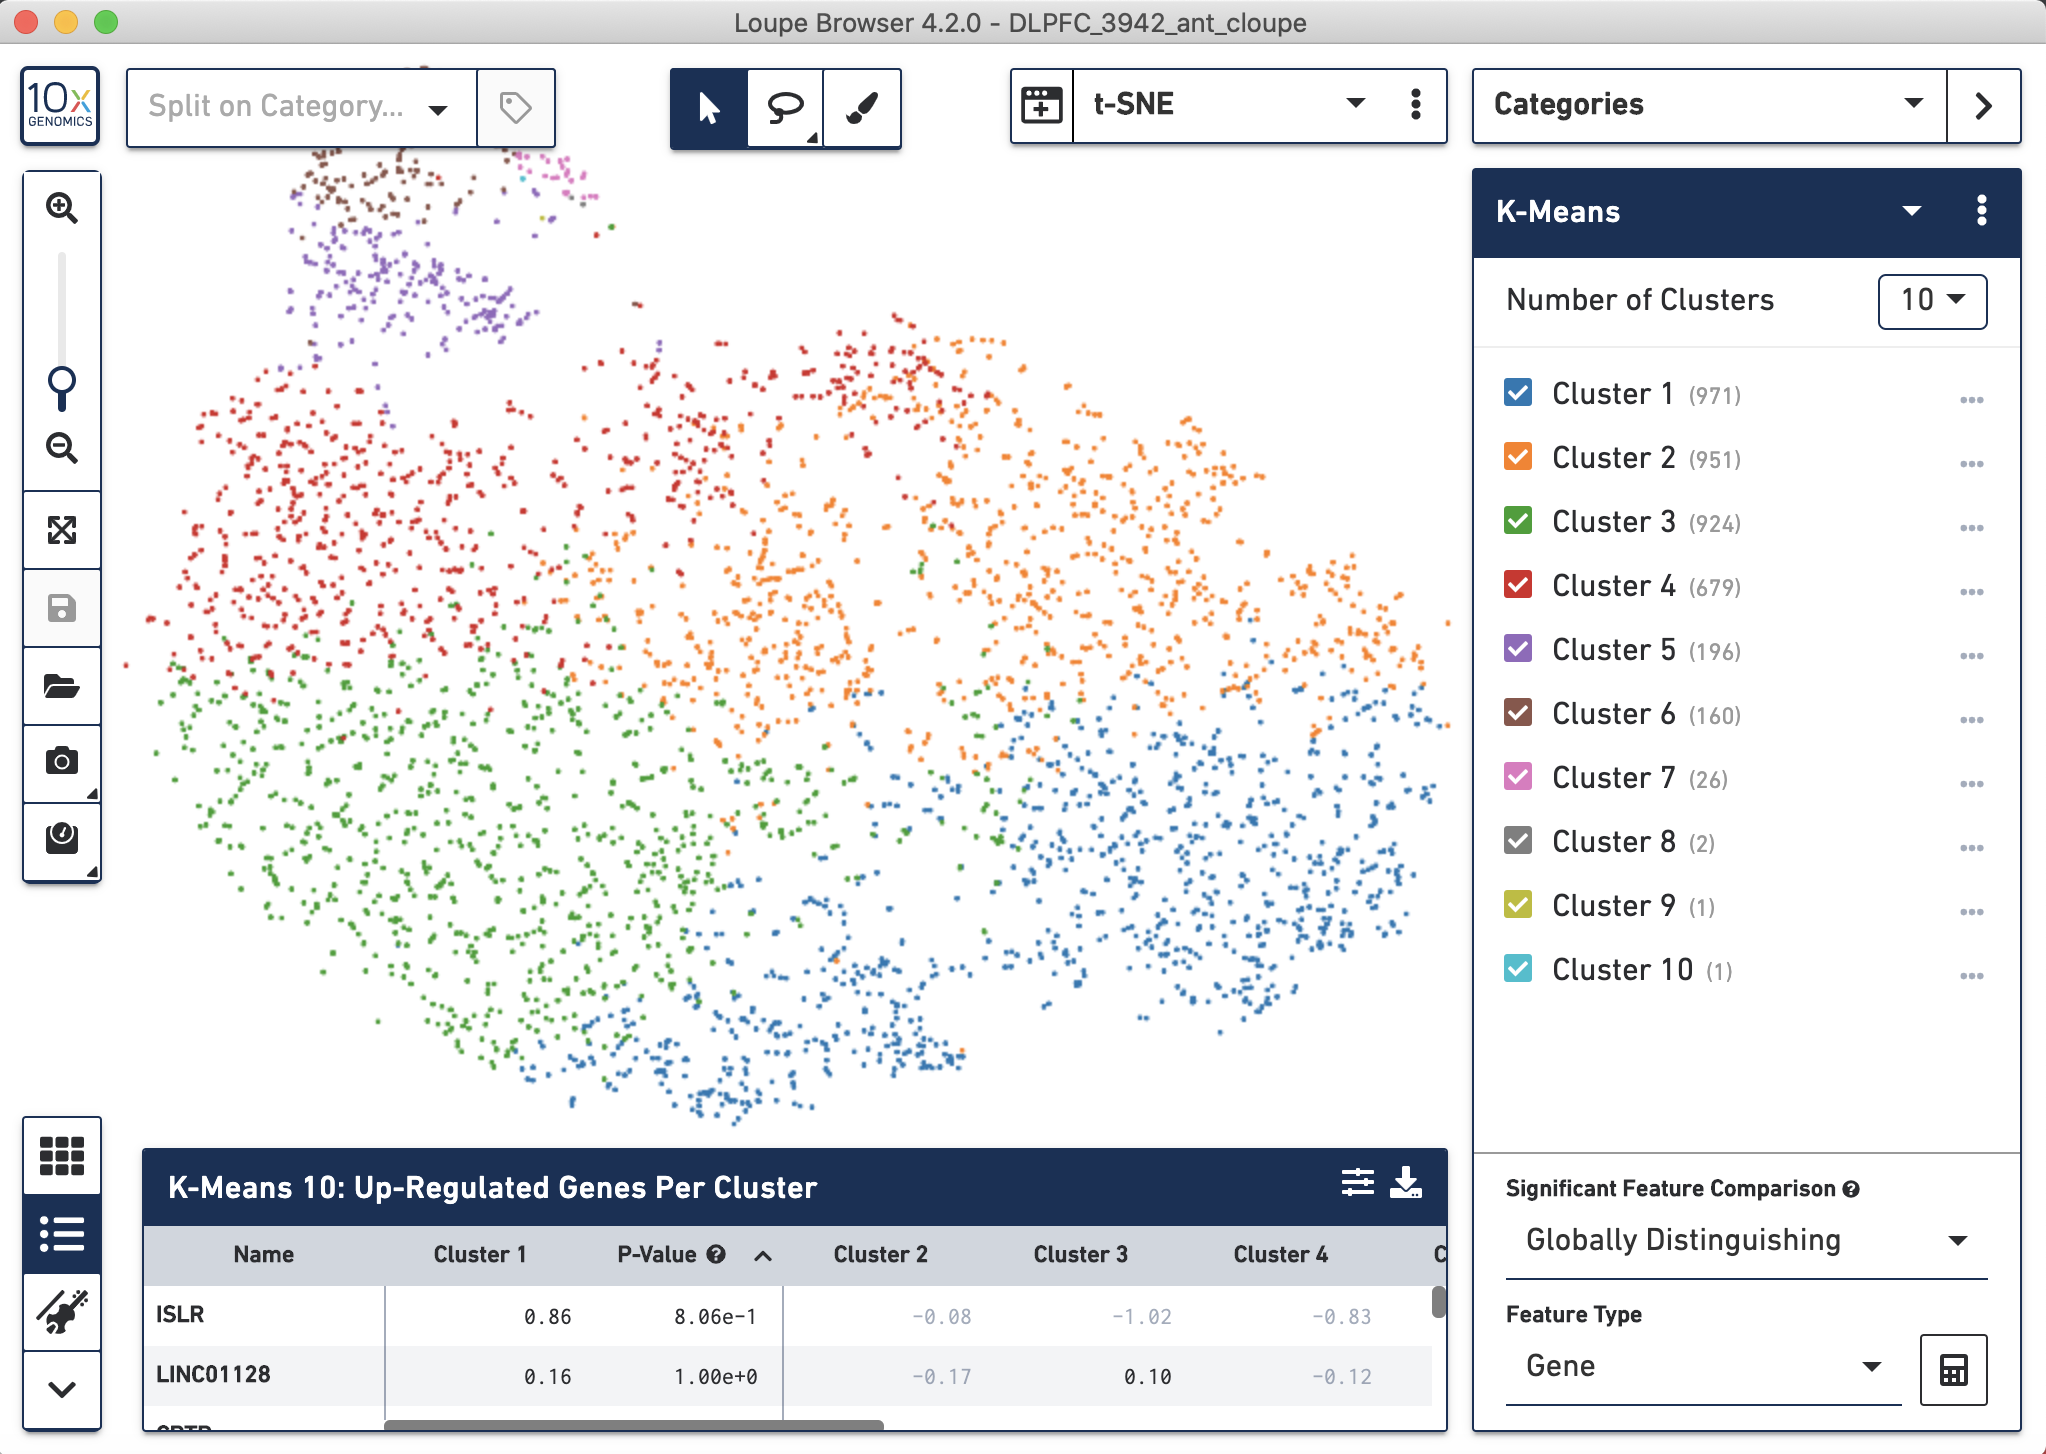
Figure 4.4: Gene expression analysis results from spaceranger count visualized with Loupe.
Most importantly you can overlay the gene expression data or annotated clusters onto the histology image. This can be done using R packages (e.g. from Bioconductor) or Python packages.
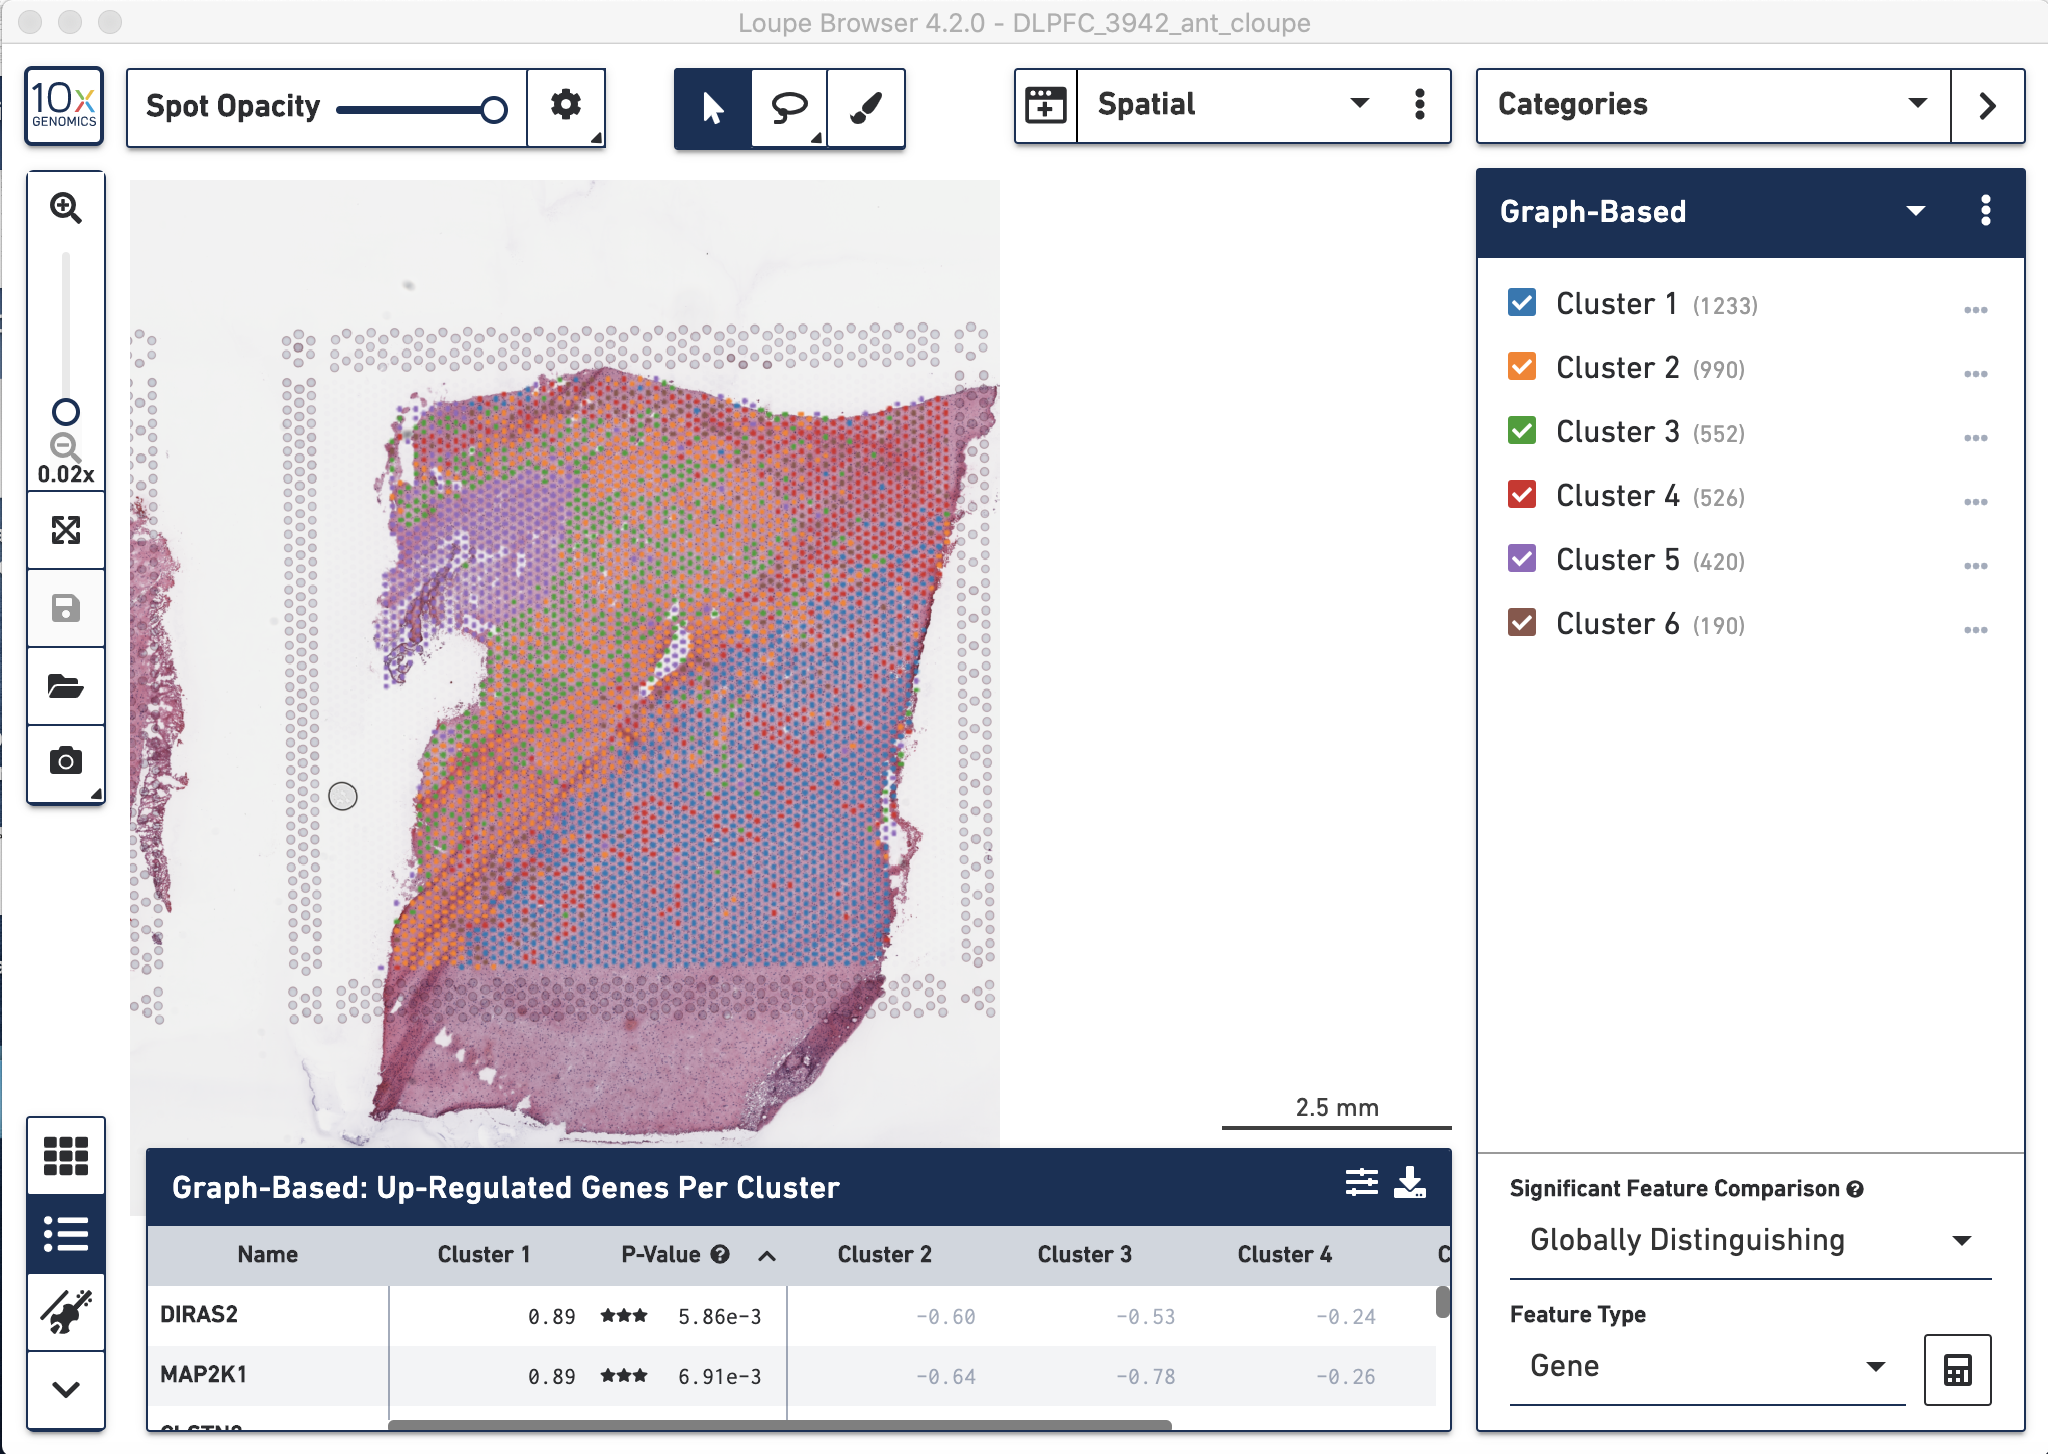
Figure 4.5: Visual inspection of the graph-based clustering results from spaceranger count visualized with the tissue histology image in the background using Loupe.
Loupe has many features, including the ability to make genes lists and plot marker genes spatially.
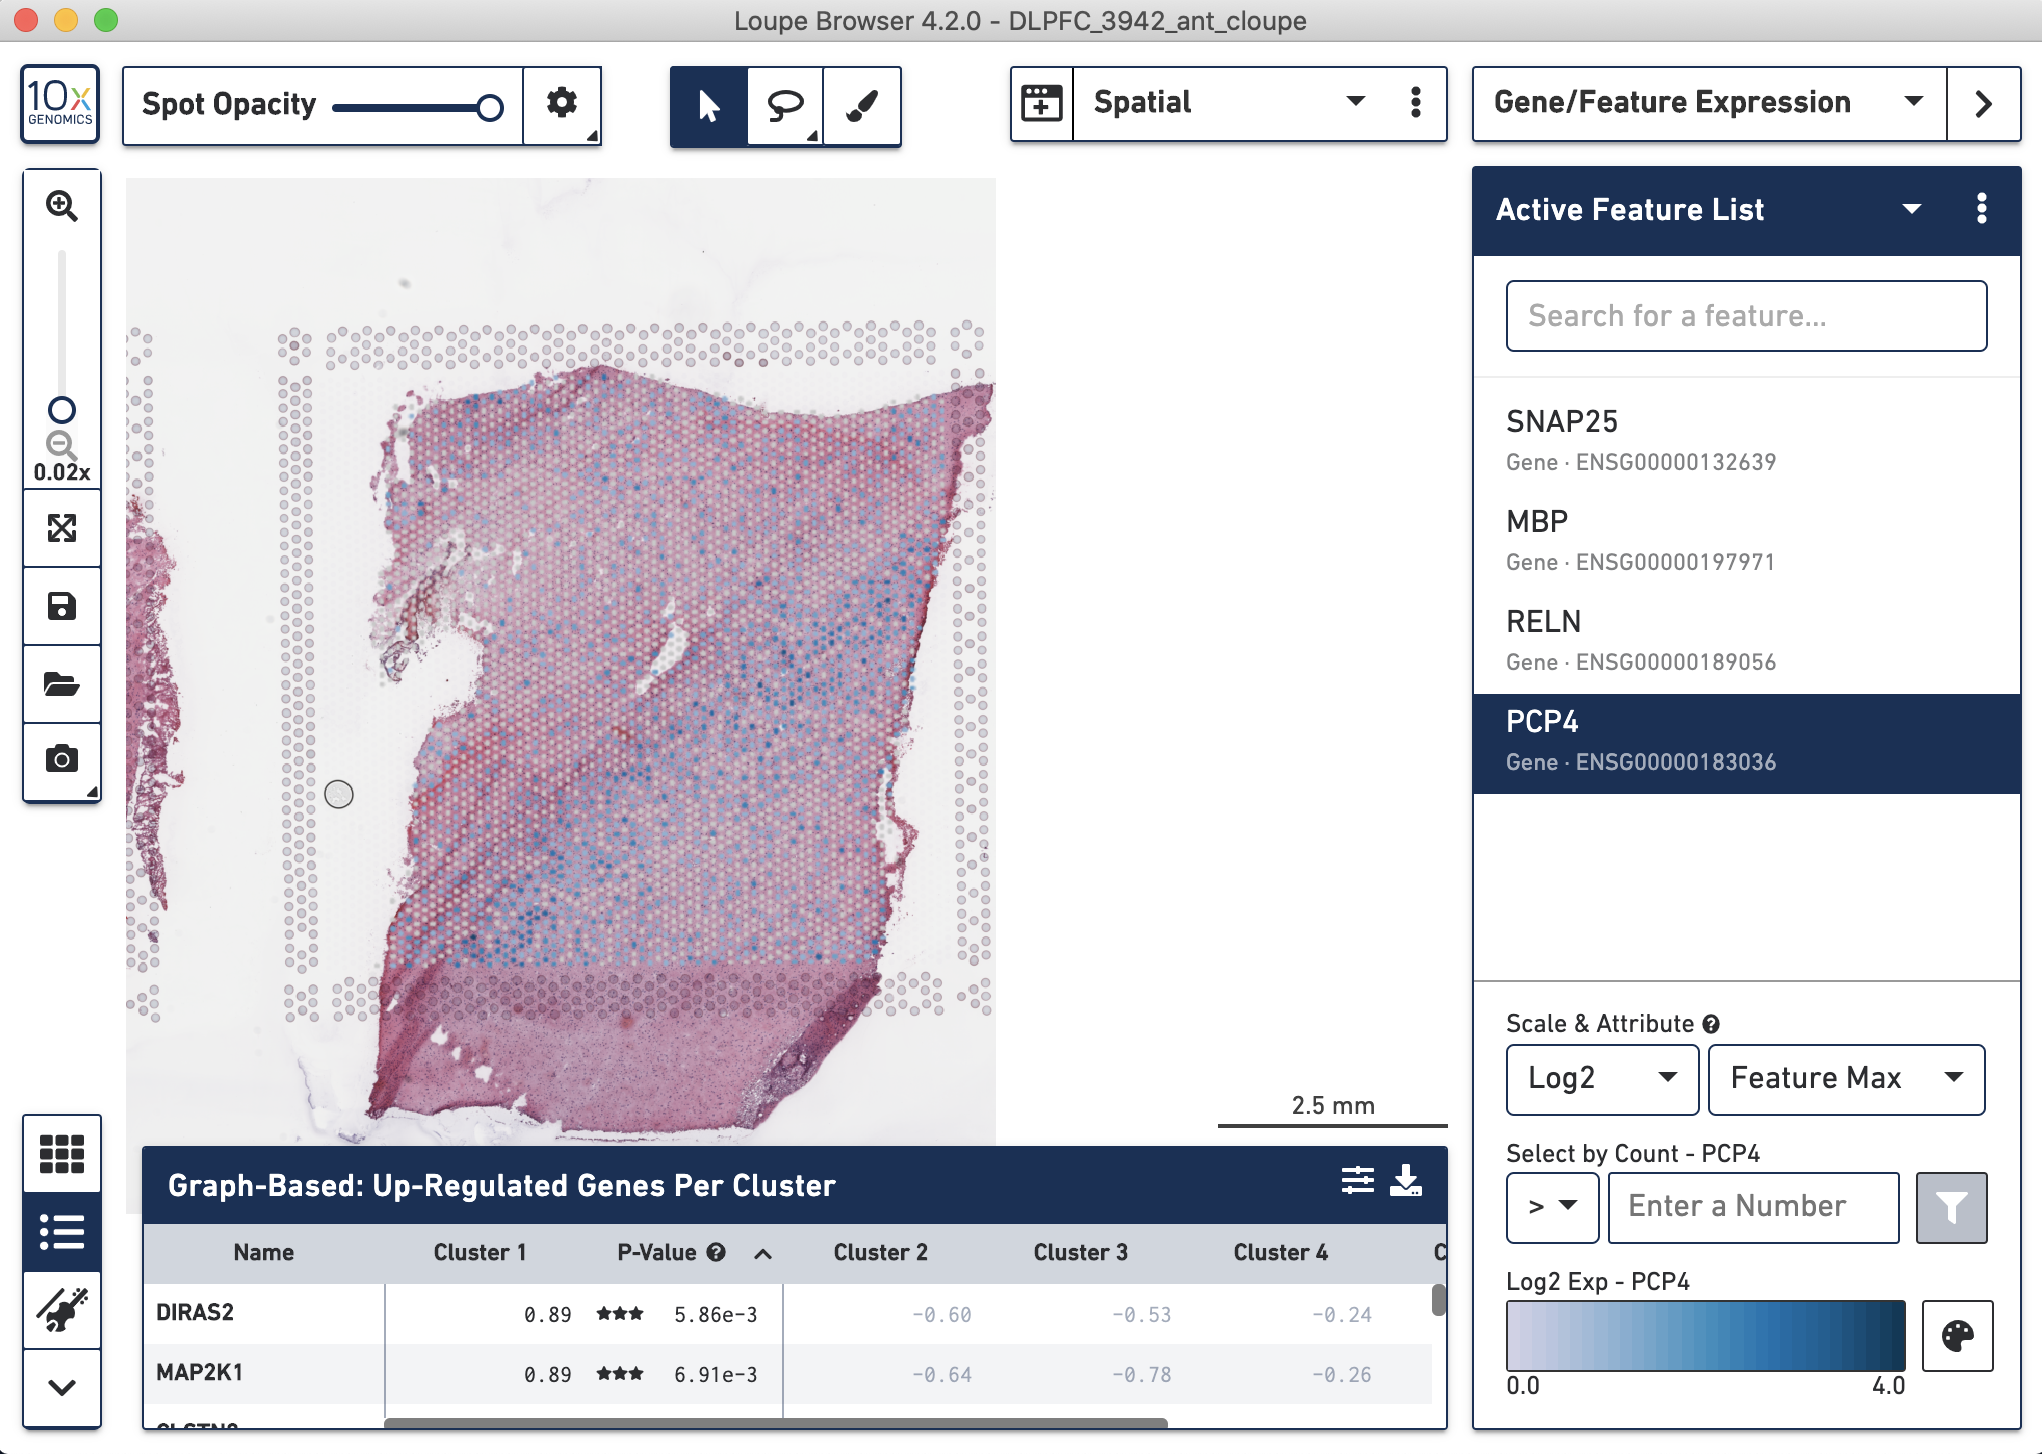
Figure 4.6: Visualization with Loupe of four marker genes in the dorsolaterl prefrontal cortex (DLPFC): SNAP25 for neurons, MBP for glia, RELN for DLPFC layer 1 of the greay matter (neurons), and PCP4 for DLPFC layer 5. Only PCP4 is shown since this is the selected gene in our gene list.
You can also make violin plots to explore gene expression differences across spots grouped by some discrete variable, such as cluster membership.
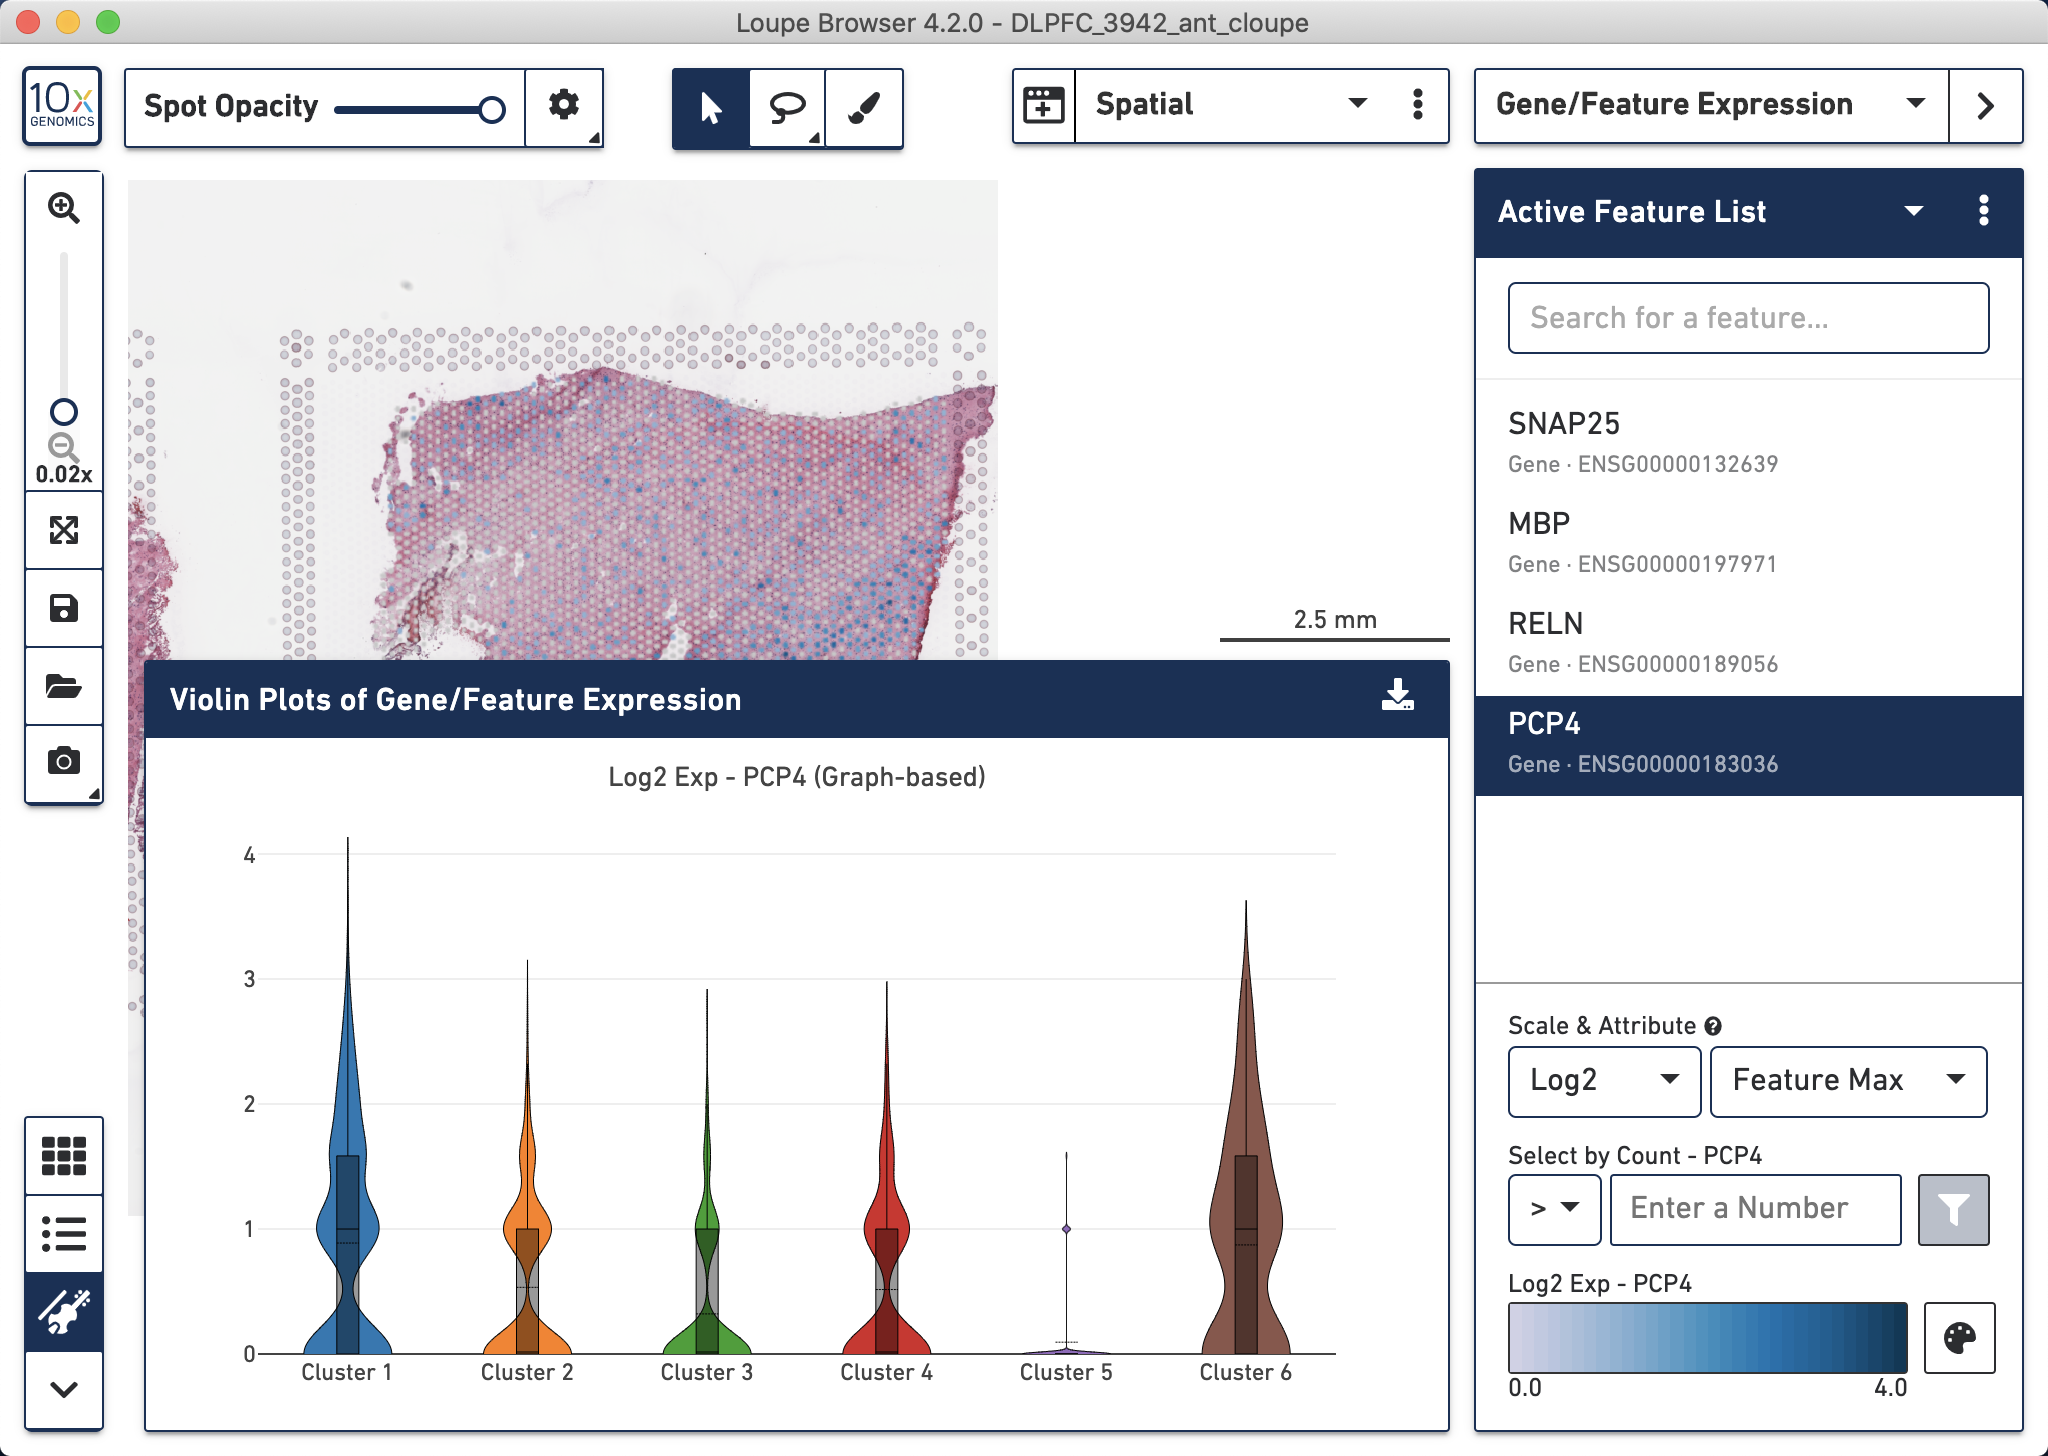
Figure 4.7: PCP4 violin plots made with Loupe showing the log2 gene expression counts on the Y-axis.
Furthermore with Loupe you can look at differential expression statistic results for each gene across clusters.
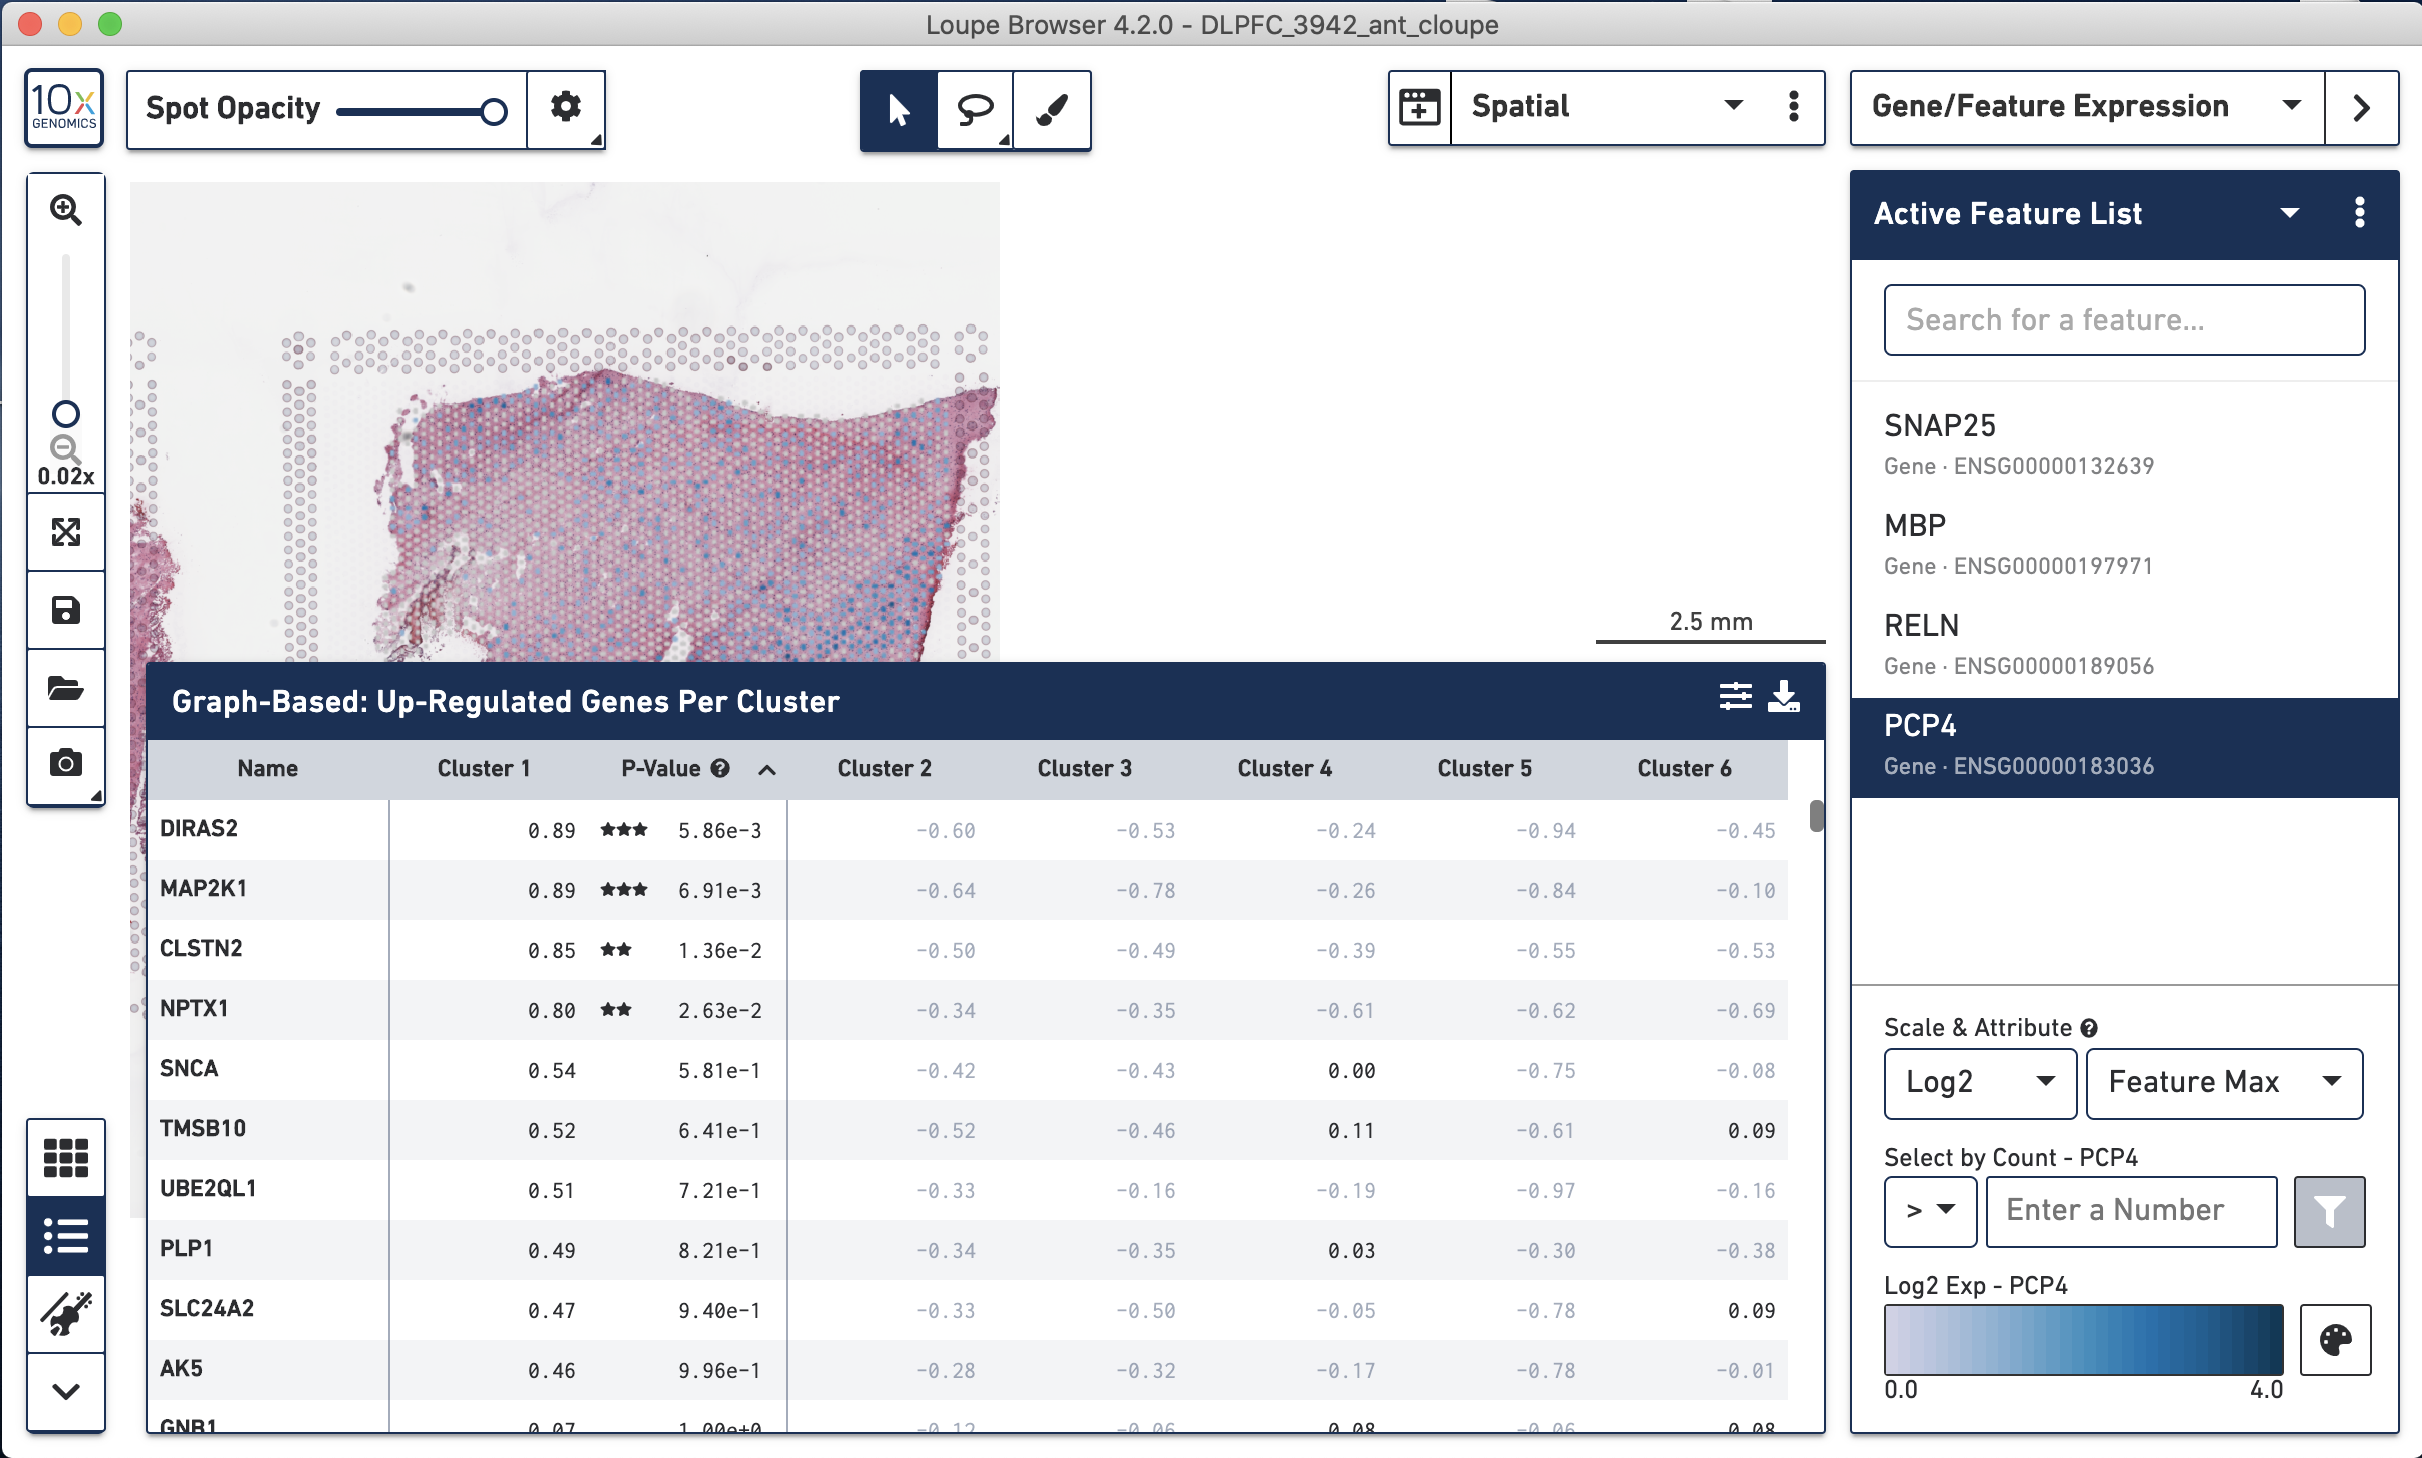
Figure 4.8: Differential gene expression statistics displayed by Loupe.
4.5 Wrapping up
Loupe can be particularly useful for annotating spots based on the clustering, dimension reduction, and known marker gene expression results from spaceranger count. That is, Loupe is a much more powerful interactive software than the web_summary.html file we will see in the Space Ranger chapter.
While all these downstream analyses Loupe enables are the ones we are interested in doing, you might want to have more control in the choice of algorithms and parameters. Furthermore, you might want to analyze the data from multiple Visium capture tissue sections together, depending on the design of your Visium experiment. This can be done using R packages (e.g. from Bioconductor) or Python packages.