library(SpatialExperiment)
library(here)
spe <- readRDS(here("outputs/spe_cluster.rds"))13 Differential expression
13.1 Overview
In this chapter, we perform differential expression testing between clusters or spatial domains to identify representative marker genes for each cluster or spatial domain.
13.2 Load data from previous steps
We start by loading the data object(s) saved after running the analysis steps from the previous chapters. Code to re-run the previous steps is shown in condensed form in Chapter 4.
13.3 Differential expression testing
Identify representative marker genes for each cluster or spatial domain by testing for differential gene expression between clusters.
Here, we use the findMarkers implementation in scran (Lun, McCarthy, and Marioni 2016), using a binomial test, which tests for genes that differ in the proportion expressed vs. not expressed between clusters. This is a more stringent test than the default t-tests, and tends to select genes that are easier to interpret and validate experimentally.
library(scran)
library(scater)
library(pheatmap)
# set gene names as row names for easier plotting
rownames(spe) <- rowData(spe)$gene_name
# test for marker genes
markers <- findMarkers(spe, test = "binom", direction = "up")
# returns a list with one DataFrame per cluster
markersList of length 6
names(6): 1 2 3 4 5 6# plot log-fold changes for one cluster over all other clusters
# selecting cluster 1
interesting <- markers[[1]]
best_set <- interesting[interesting$Top <= 5, ]
logFCs <- getMarkerEffects(best_set)
pheatmap(logFCs, breaks = seq(-5, 5, length.out = 101))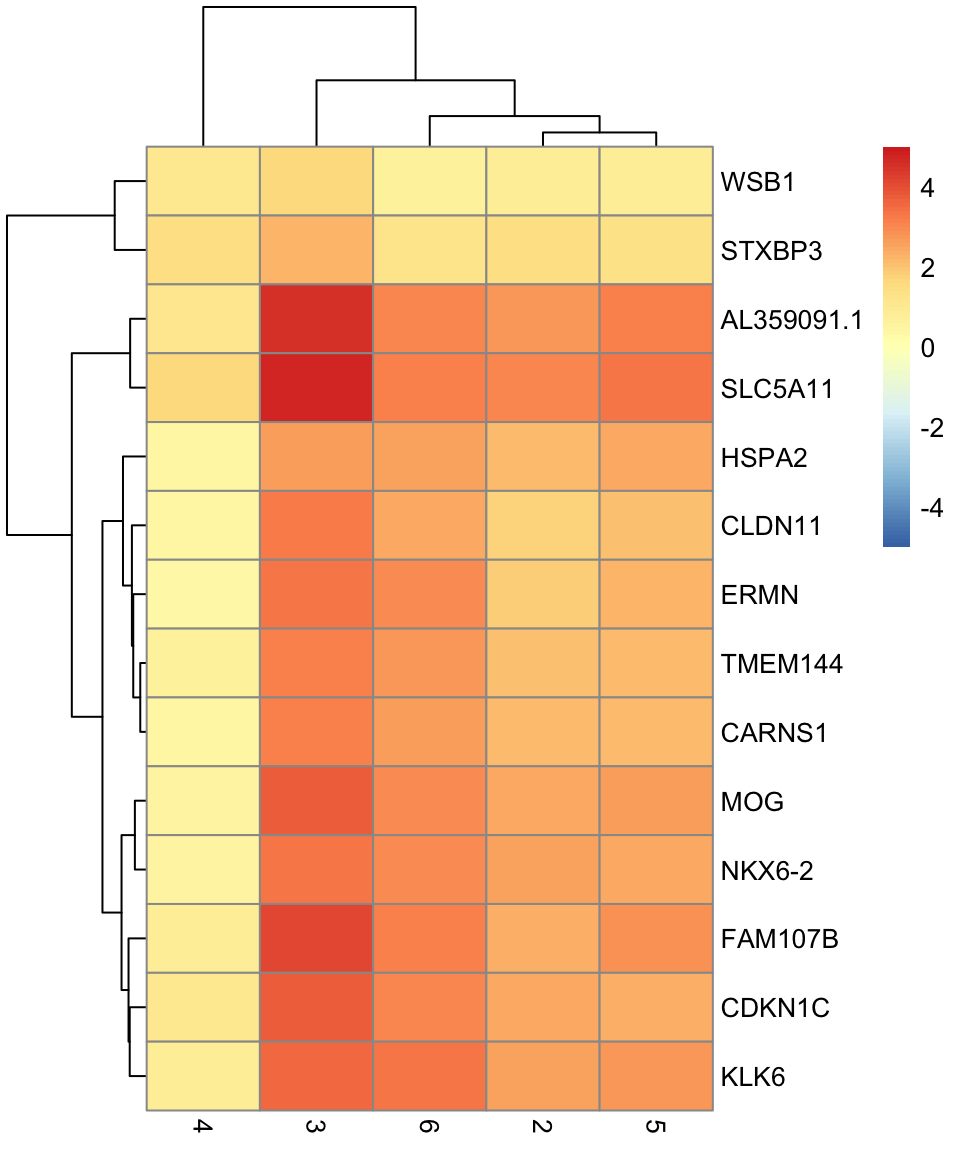
# plot log-transformed normalized expression of top genes for one cluster
top_genes <- head(rownames(interesting))

plotExpression(spe, x = "label", features = top_genes)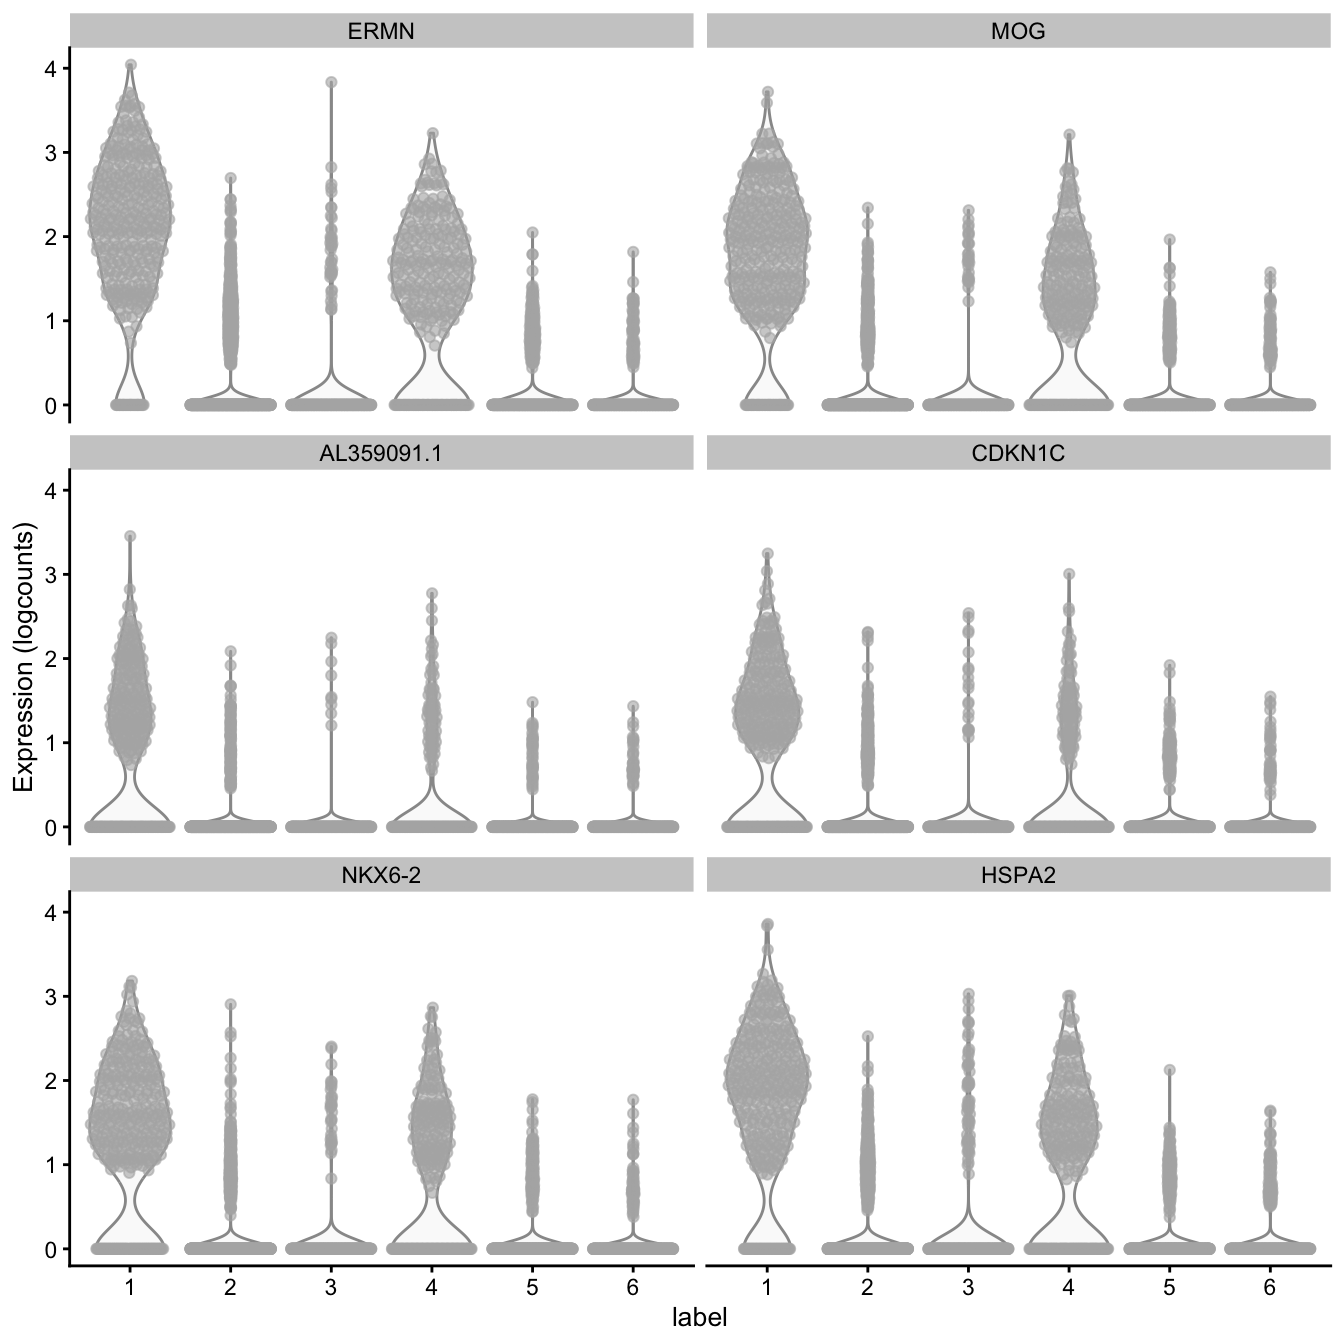
13.4 Pseudobulking
Alternatively, we can proceed by manually aggregating the counts per cluster or spatial domain, which is referred to as ‘pseudobulking’. Then, we can perform differential expression testing between the pseudobulked clusters or spatial domains.